Why Your Bounce Rate Is High (And What to Actually Do About It)
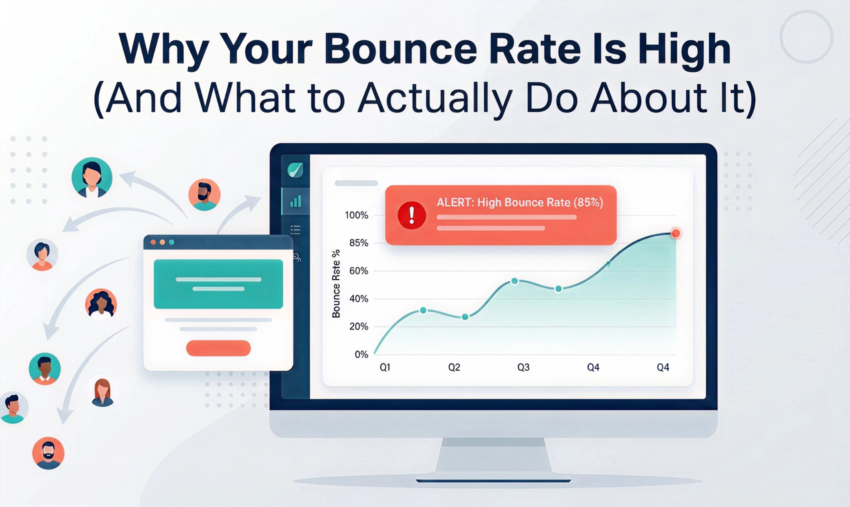
You open Google Analytics, look at your bounce rate, and feel that familiar knot in your stomach.
60%. 70%. Sometimes higher.
You’ve read that 40% is “good.” Yours isn’t 40%. So now what?
Here’s the truth: bounce rate is one of the most misunderstood metrics in digital marketing. Most businesses treat it like a verdict. High bounce rate means bad website. But that’s not the full story. And if you’re chasing the number without understanding why it’s high, you’ll waste time fixing the wrong things.
This guide cuts through it. We’ll show you what actually causes high bounce rates, how to diagnose your specific problem, and the fixes that move the needle. Not just the ones that look good on a report.
Before You Fix Anything, Understand What You’re Actually Measuring
A bounce happens when someone lands on your website and leaves without taking another action. No second page. No click. No form submission. Just in, then out.
In GA4, it’s called an “engagement rate.” Sessions that lasted less than 10 seconds, had no conversion event, and had no second page view. Same idea, slightly different measurement.
What it doesn’t tell you is why they left. That’s the part most people skip.
Four Reasons People Leave (And Only One of Them Is Your Website’s Fault)
Before you start redesigning pages or rewriting copy, you need to know which problem you actually have. They require completely different solutions.
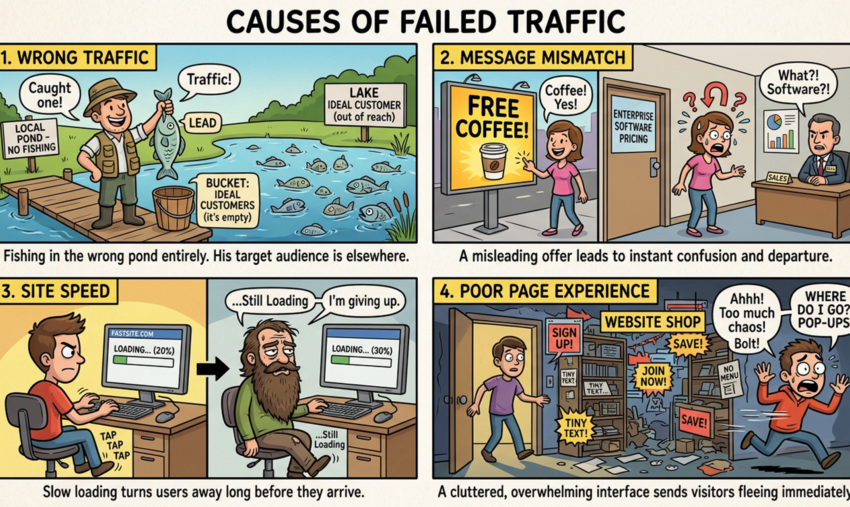
1. You’re Paying to Attract People Who Were Never Going to Buy
This is the most common culprit. And the most overlooked.
If your Google Ads or SEO campaigns are pulling in visitors who aren’t a fit for your offer, they’ll leave. Fast. Not because your website is bad. Because you’ve served them the wrong thing.
Signs this is your problem:
- High bounce rate from specific traffic sources (paid, organic, social)
The fix isn’t on your website. It’s in your targeting. Tighten your keyword match types. Tighten your audience segments. Be more specific about who you’re reaching and what you’re promising them before they click.
2. Your Ad Promised One Thing and Your Page Delivered Another
When someone clicks an ad or an organic result, they have an expectation. If your landing page doesn’t immediately deliver on that expectation, they’re gone.
This is called “message mismatch.” And it kills conversions before they have a chance to start.
Classic examples:
- A Google Ad promises “Same-Day Plumbing Sydney” but the landing page is your generic homepage
Signs this is your problem:
- High bounce rate specifically from paid traffic
The fix: make sure every entry point delivers exactly what it promised. Dedicated landing pages for campaigns. H1 headings that match ad copy. The CTA visible without scrolling. Our PPC management team builds message-matched landing pages as part of every campaign setup for exactly this reason.
3. Your Site Is So Slow That People Leave Before They Even Arrive
Page speed is non-negotiable. If your site takes more than three seconds to load on mobile, a significant portion of your visitors will never see your content.
They’ve already bounced before the page even rendered.
In Australia, mobile usage is high and patience is low. A slow site isn’t just a bad experience. It’s an immediate exit.
Signs this is your problem:
- High bounce rate on mobile specifically
The fix: this is a technical problem that needs a technical solution. Image compression, proper caching, a content delivery network (CDN), and cleaning up unnecessary plugins or scripts. Our WordPress development team handles exactly this kind of performance work, and a good web hosting setup makes a significant difference too. Sub-two-second load times are achievable on most sites with the right stack.
4. You Got Them There, Then Made It Too Hard to Stay
Even if you’ve got the right traffic, the right message, and a fast load time, a bad experience will still send people away.
This covers a lot of ground:
- Mobile layout that’s hard to navigate
Signs this is your problem:
- High bounce rate across desktop and mobile
The fix: conversion rate optimisation (CRO). This means testing, iterating, and making deliberate improvements based on data. Not gut instinct. It’s a core part of what we do through our web design and UX service, and it’s often where the biggest gains are found.

Stop Guessing. Here’s How to Find Out Exactly What’s Going Wrong
Don’t guess. Use data.
Step 1: Segment your bounce rate by traffic source. Open GA4, go to your acquisition report, and look at bounce rate by channel. Is paid traffic bouncing more than organic? Is social disproportionately high? This tells you where to focus.
Step 2: Segment by device. If mobile bounce rate is significantly higher than desktop, speed and mobile UX are the priority. If they’re similar, the problem is likely content or targeting.
Step 3: Segment by landing page. Which pages have the highest bounce rates? Cross-reference with their traffic sources. A blog post with a 70% bounce rate isn’t necessarily a problem. It might be answering a question, and people got what they needed. A service page with 70% bounce rate is a problem.
Step 4: Use Google Search Console. Are you ranking for keywords that don’t match your offer? This is your message mismatch warning sign. Fix the content or target different keywords. If you’re not sure how to read what Search Console is telling you, our SEO team can walk you through it.
Step 5: Run a PageSpeed Insights check. Go to pagespeed.web.dev and run your key pages. If you’re scoring under 50 on mobile, speed is almost certainly a contributing factor.
The Fixes That Actually Move the Number (And the Business)
Here’s what moves the needle. Not in theory, but in practice.
Match every ad to a dedicated landing page. Generic homepages are bounce rate killers for paid traffic. If you’re running Google Ads campaigns to multiple audience segments, build pages for each segment. It’s more work upfront and it pays off every month.
Put your most important content above the fold. Don’t make people scroll to find out what you do and why they should care. Your value proposition, your key proof point, and your CTA should be visible immediately. On mobile and desktop.
Compress and lazy-load images. Oversized images are one of the most common causes of slow load times. Tools like ShortPixel or Smush can compress images automatically in WordPress. And images below the fold should load only when the user scrolls to them. Our WordPress development team handles this as standard.
Remove aggressive pop-ups. An exit-intent pop-up after 30 seconds? Potentially useful. A pop-up that fires five seconds after landing, before the user has read a single word? That’s a bounce trigger. Give people time to engage before asking for anything.
Add social proof where decisions happen. Reviews, client logos, case study snippets, and credentials should appear near your CTAs. Not buried on a testimonials page nobody visits. People need proof at the moment they’re deciding whether to trust you. Take a look at our case studies to see how we structure this for clients across a range of industries.
Write for scannability. Most people don’t read websites. They scan. Short paragraphs, clear subheadings, bold key points. If someone can’t understand your offer by scanning for five seconds, they’ll leave.
Fix your mobile navigation. If your mobile menu is hard to find, your pages are hard to tap, or your forms are frustrating on a phone, fix that first. Mobile experience is not optional. If a redesign is overdue, our web design team can assess what’s needed and recommend the right approach.
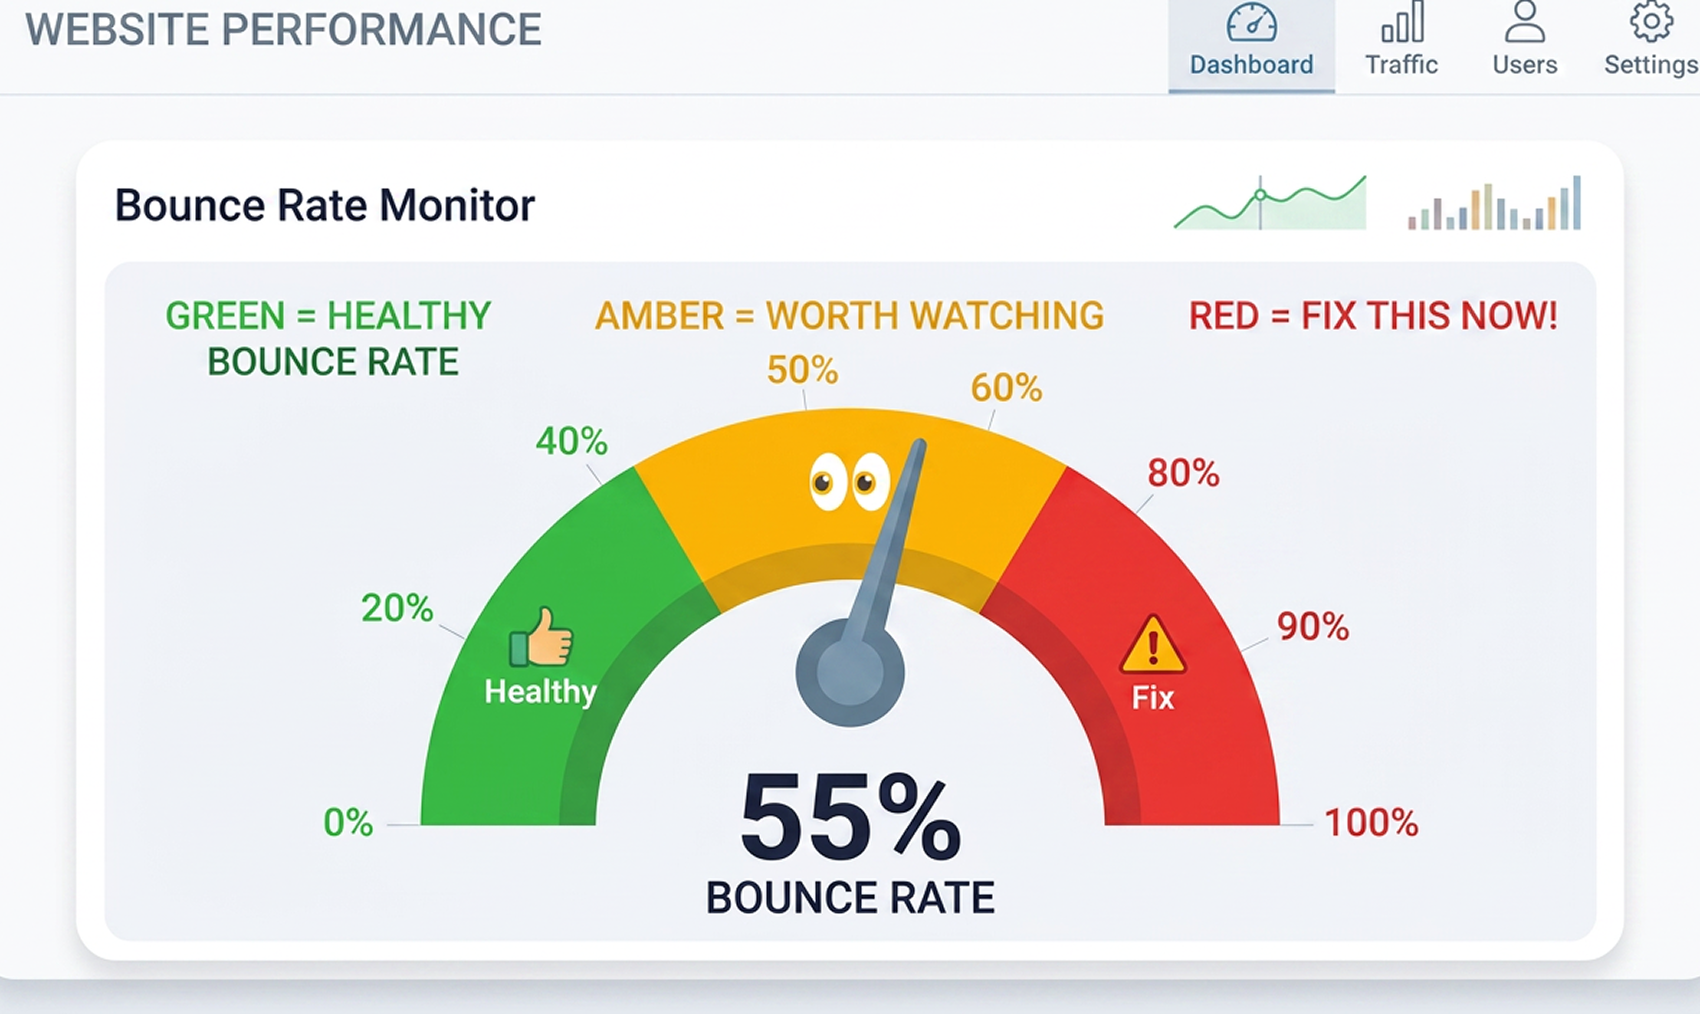
Is Your Bounce Rate Actually a Problem? Here’s How to Tell
Context matters more than the number.
| Page Type | Typical Bounce Rate |
| Blog posts and articles | 65–90% (normal. People read and leave.) |
| Landing pages for paid campaigns | 20–50% (aim for the lower end) |
| Service pages | 40–65% |
| Contact and enquiry pages | 20–40% |
| eCommerce product pages | 30–55% |
If your blog is at 75%, that’s not a crisis. If your key service page or campaign landing page is at 75%, that’s lost revenue. And it’s worth fixing.
A High Bounce Rate Is a Symptom. Find the Cause.
Bounce rate is a symptom. It tells you something is off. It doesn’t tell you what.
The businesses that get this right are the ones that treat it as a diagnostic tool rather than a scoreboard. They dig into the data, find the real cause, and apply targeted fixes. Not blanket changes that shift the number without improving the business.
That’s the approach we take with every client at Click Click Media. We don’t just tell you your bounce rate is high. We show you exactly where the problem is and what it’s costing you in leads and revenue. Whether that means fixing your Google Ads targeting, rebuilding your SEO strategy, or improving your website design and performance, we find the lever that moves things.
If your website is losing visitors and you want to know why, get in touch with our team. We’ll take a look and give you a straight answer.