Google Search Console: The Complete Guide for Australian Businesses (2026)
Set it up right, read it properly, and turn free Google data into real ranking and traffic growth.
Your website is live. But can Google actually find your pages? What are Australians searching to reach you? Which content is quietly losing ground? Google Search Console answers all of that. And it costs nothing.
Most business owners either do not know it exists or set it up once, click around for three minutes, and quietly close the tab forever. This guide covers everything: setup, every major report, the newer features most guides skip, and how to turn the data into decisions that move traffic.
TL;DR
Google Search Console is free, it tells you exactly how Google sees your site, and most people barely use it. Here is what actually matters.
Set it Up – Use the Domain property. Verify via DNS. Link it to GA4. Do it now. It only stores data from the moment you connect.
Watch Weekly – Check Insights for declining pages. Filter to non-branded queries. Sort by impressions. Those are your SEO priorities.
The Big Opportunity – Pages ranked 8 to 20 with high impressions and low CTR. Fix the title and meta description. No ranking change needed.
The Data Limit – GSC caps at 16 months and 1,000 queries. If you need more, connect it to BigQuery. Most businesses do not.
The rest of this guide covers every report, every newer feature, and how to use the data to actually grow traffic.
What is Google Search Console?
Google Search Console (GSC) is a free tool that shows how your website performs in Google Search. Think of it as Google talking directly to you about how it sees your site. (It does not say much, but when it does, you should listen.)
It tells you:
- Which pages Google has indexed and which it has not
- How many times your site appeared in search results
- How many people clicked through to your site
- What search queries triggered your pages
- Whether technical problems are blocking Google from reading your site correctly
GSC VS GOOGLE ANALYTICS – Google Analytics shows what visitors do after they arrive. Google Search Console shows what happens before they click, inside Google Search itself.Together they give you the full picture. Connecting them (covered later) makes both far more useful.
GSC stores up to 16 months of data from the moment you verify ownership. It does not backfill historical data. Set it up now and the archive grows from there. Future you will be grateful. Current you gets no credit.
How to Set Up Google Search Console
Step 1: Add your property
Go to search.google.com/search-console and sign in. Use your business Google Workspace account, not a personal Gmail. If the person who set it up leaves, you want to keep ownership.
- Click Start Now and sign in.
- Click Add Property in the top-left dropdown.
- Choose your property type. Domain property (recommended) or URL prefix (more limited but easier to verify).
- Enter your domain without https:// for a domain property, or the full URL for a URL prefix property.
DOMAIN PROPERTY VS URL PREFIX: WHAT TO CHOOSE
The Domain property covers all URLs across all subdomains, http and https, in one view. Requires DNS verification but is the more comprehensive option.
The URL prefix is easier to verify but only captures the exact URL you enter. Separate properties for www and non-www, or http and https.
Use Domain if you have registrar access (VentraIP, Crazy Domains, GoDaddy, Cloudflare; or wherever your web person set it up and definitely wrote down in a safe place). Use URL prefix if you only manage a specific subdomain and registrar access is not available.
Step 2: Verify ownership
Google needs proof you own the site before sharing data. Five verification methods. Pick the one that matches your setup.
- DNS TXT record: Add a text record to your domain registrar. Best for domain-level properties. Works with all major AU registrars.
- HTML meta tag: Paste a tag into your homepage <head>. Good if you have CMS access (WordPress, Shopify, Squarespace).
- Google Tag Manager: If GTM is already on your site, verify instantly through it. No code changes needed.
- Google Analytics: If GA4 is already connected with edit-level access, verify instantly through it.
- HTML file upload: Download a small file from Google and upload it to your website root directory.
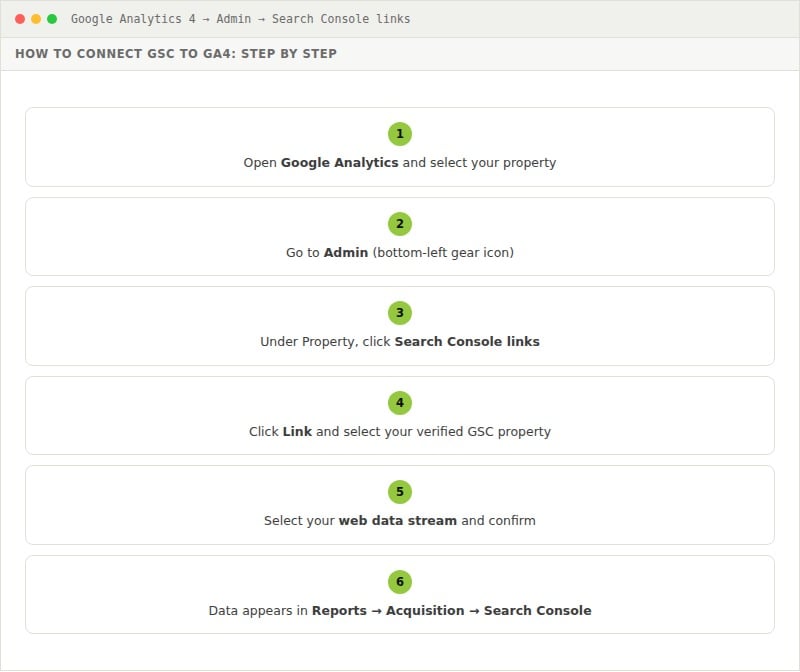
Step 3: Link to Google Analytics
Connecting the two platforms unlocks search query data inside GA4, so you can see the full journey from search term to on-site behaviour, conversions, and revenue.
- Open Google Analytics and select your property.
- Go to Admin (bottom-left gear icon).
- Under Property, click Search Console links.
- Click Link and select your verified GSC property.
- Select your web data stream and confirm.
- Data appears in Reports → Acquisition → Search Console.
Understanding the GSC Dashboard
The left-hand navigation is where you will spend most of your time. Here is what each section does.
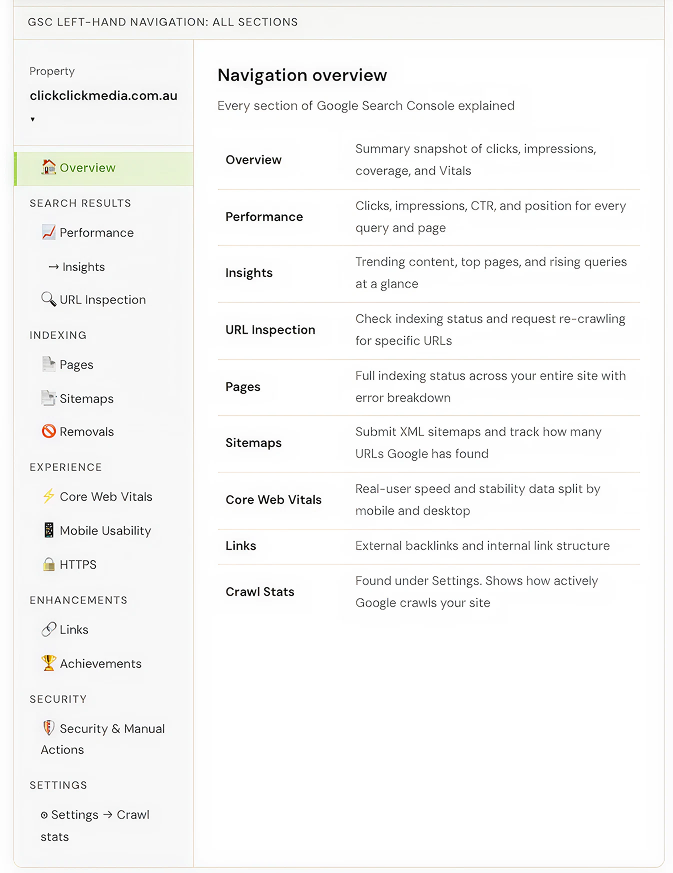
The Performance Report: Your Most Important View
Most of your GSC time should go here. Four core metrics.
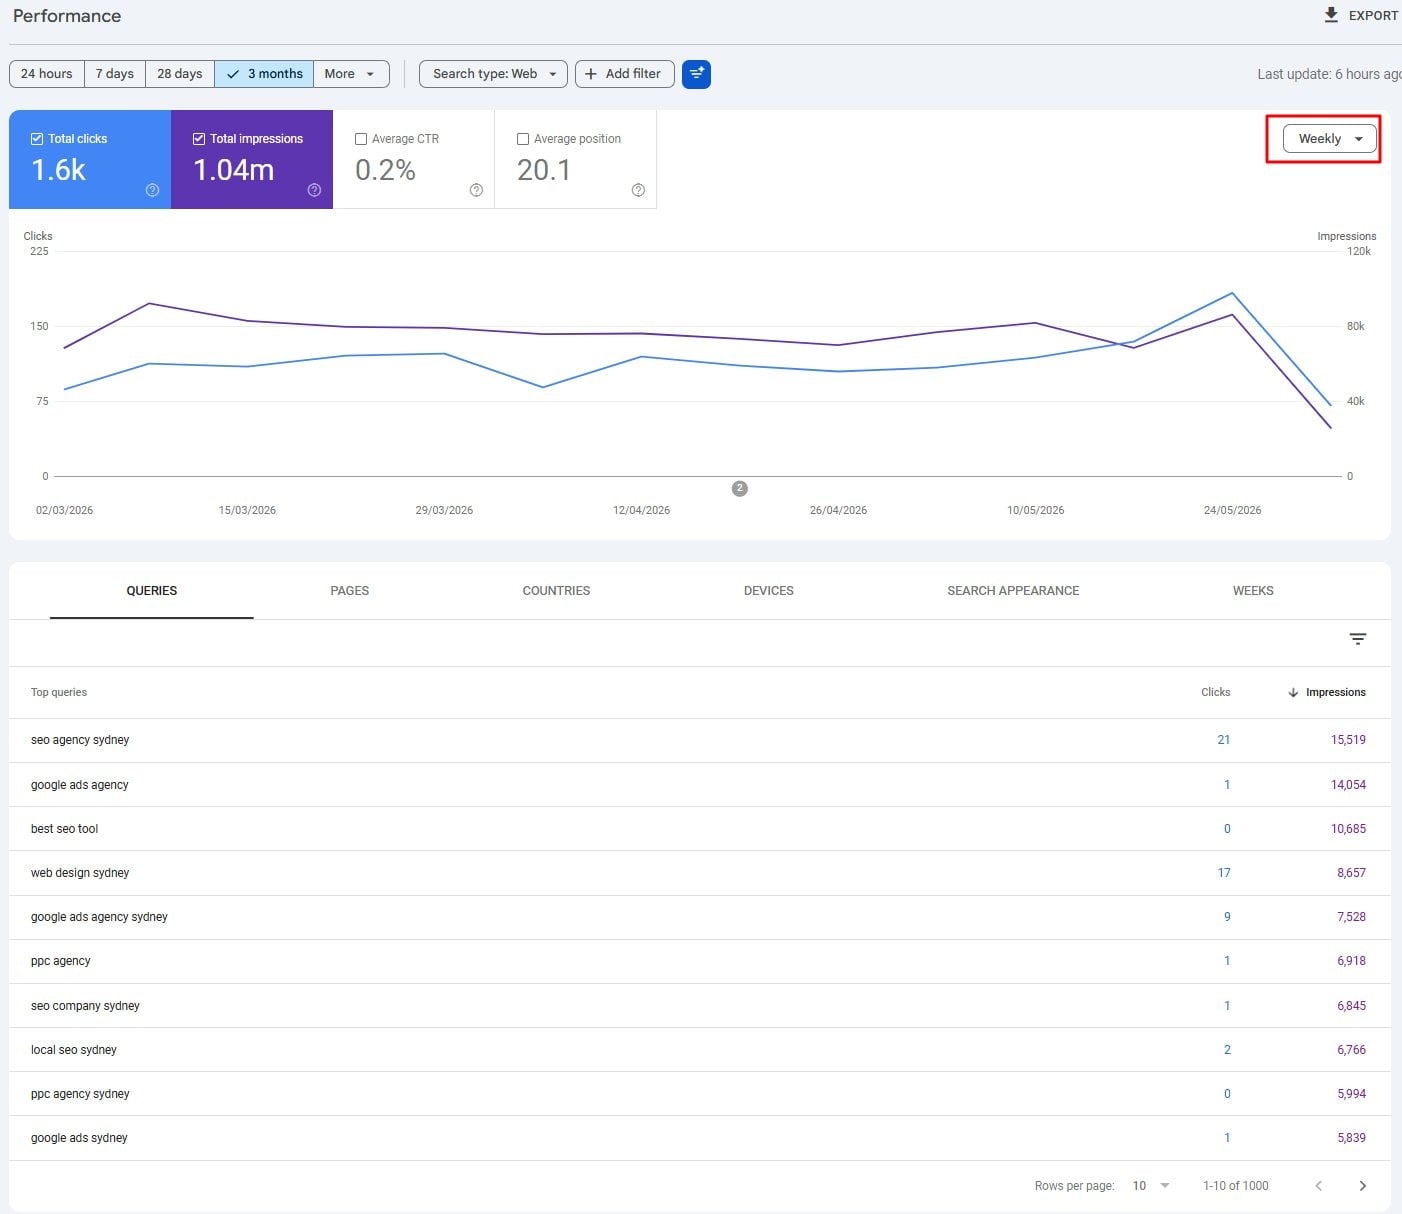
The four metrics at the top of the report:
Clicks: How many times someone clicked through to your site from Google. Real traffic. Not just appearances.
Impressions: How many times your site appeared in search results, regardless of whether it was clicked. A page can rack up thousands of impressions and still send no one to your site if the listing does not compel the click.
CTR (Click-Through Rate): Clicks divided by impressions. Position 1 earns roughly 25 to 30 percent CTR. Position 10 earns 2 to 3 percent. High impressions, low CTR? That is a title tag or meta description problem. Not a ranking problem. (The page is showing up. People are just scrolling past. Ouch.)
Average position: Your average ranking position across all queries that triggered your site. Use it as a trend, not a precise number. A page averaged at position 5 might rank at 1 for some queries and 25 for others.
Date and granularity filters: daily, weekly, monthly Added December 2025
In December 2025, Google added chart granularity controls to the Performance report. Before this, everything was daily. Now you can switch between Daily, Weekly, and Monthly using the dropdown in the top-right of the chart.
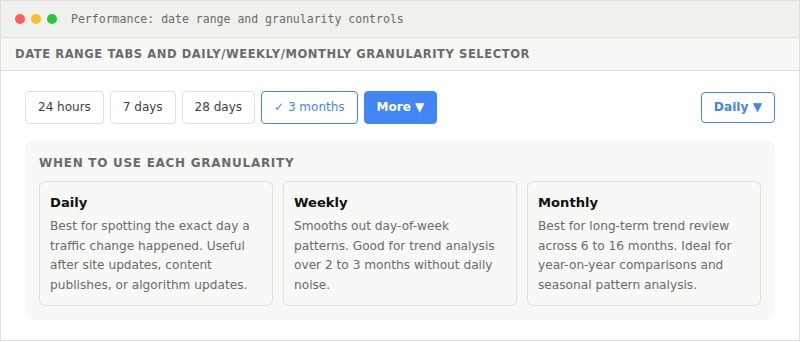
Date range tabs (24 hours, 7 days, 28 days, 3 months) set the window. The granularity control buckets it. Monthly view over a 16-month range is the clearest way to spot long-term trends and seasonal patterns.
PRACTICAL TIP
After a big site change (redesign, URL restructure, major content update), switch to Daily and narrow to the last 28 days. You can pinpoint the exact day something shifted. Useful for trends; deeply unhelpful when your developer asks “but did the deploy cause the drop?
Annotations: adding context to your chart [Added November 2025]
Traffic charts with no context have always been a frustration. You see a spike or a drop and spend time digging through calendars trying to remember what changed. In November 2025, Google fixed this with custom annotations.
Annotations let you pin a note to any date on the Performance chart. They appear as small markers on the timeline. Hover to read them. They sit alongside the system annotations Google already adds for core algorithm updates.
How to add an annotation
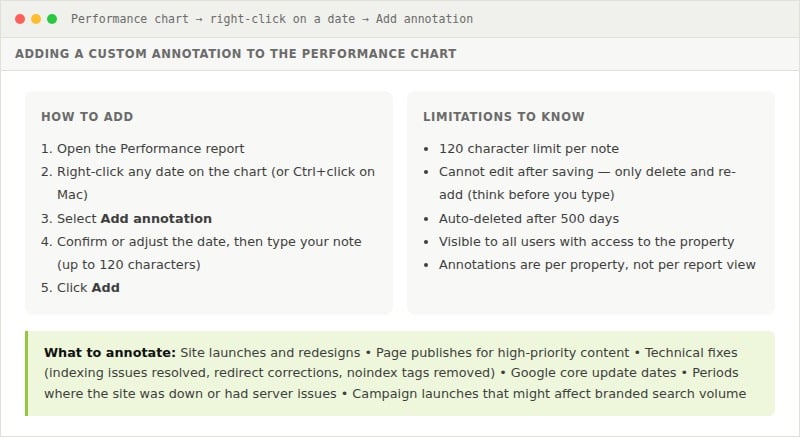
The real value is in three months, when you come back to investigate a traffic drop and the annotations tell the story immediately. No digging through Slack or deployment logs. For teams with multiple stakeholders, a consistent annotation habit creates a shared record of what happened and when.
One catch: annotations are visible to everyone with property access. Keep them factual and non-sensitive. “Launched new pricing page” or “fixed robots.txt blocking /services/”: ideal. “MD hates this homepage but signed off anyway”: leave that one out.
Filtering by branded vs non-branded queries [Added November 2025]
In November 2025, Google introduced the branded queries filter, expanding it to all eligible sites in March 2026. One click splits your Performance data into branded (people searching your business name) and non-branded (everyone else).
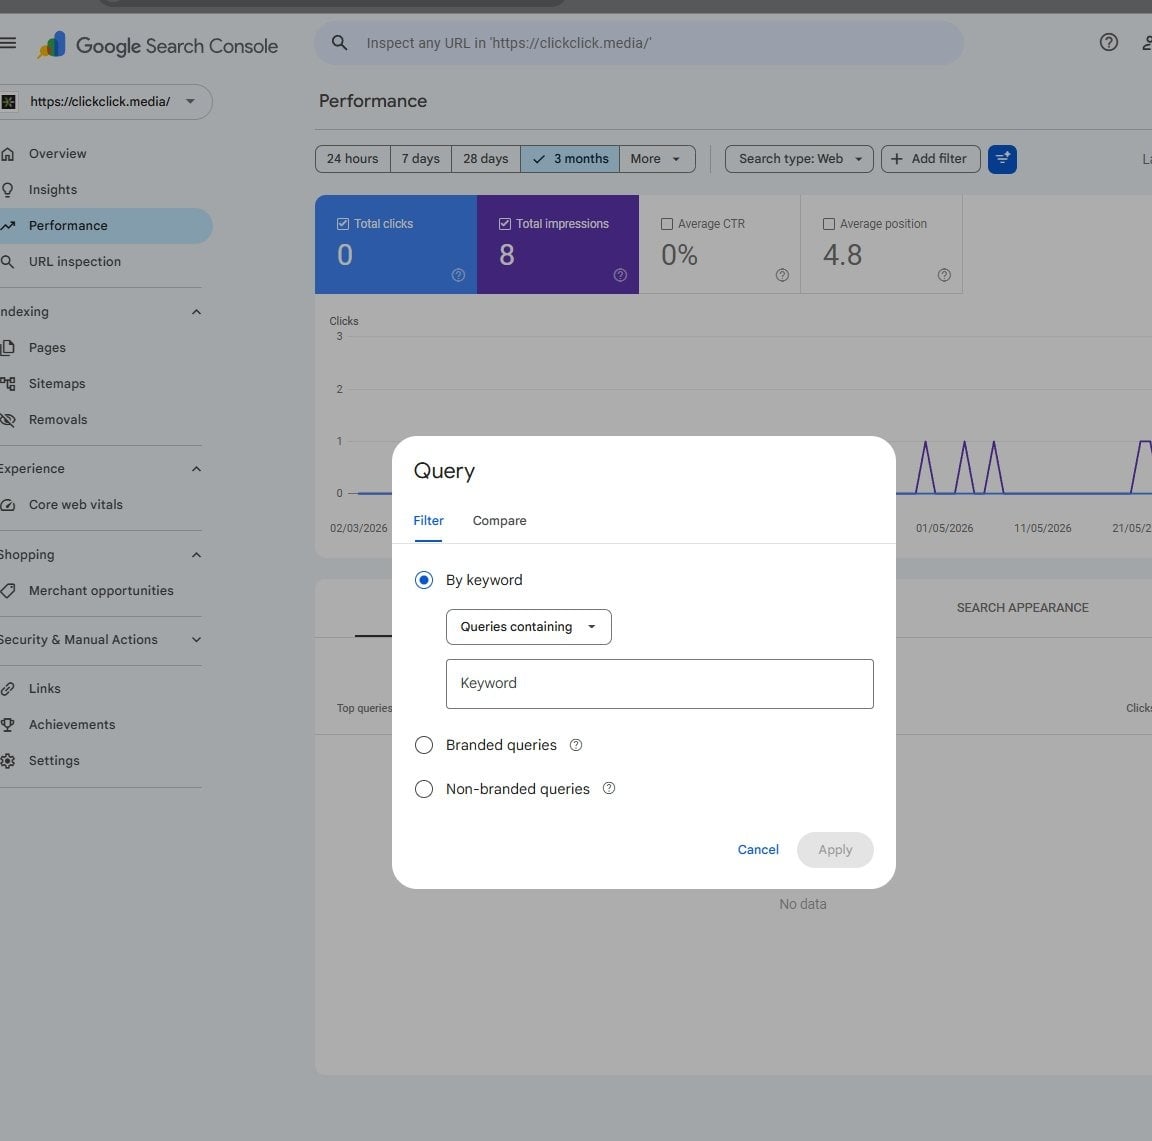
Click Add filter, select Query, and you get three options: a specific keyword, branded queries only, or non-branded queries only. Branded and non-branded traffic behave very differently:
- Branded queries: High CTR and high average position. They measure how well you are capturing existing demand for your name. Growing branded impressions means your brand is getting more visible.
- Non-branded queries: These are people searching for what you sell without knowing your name yet. Your SEO job is to change that.
HOW TO USE THIS IN PRACTICE
Filter to non-branded, sort by impressions descending. Every query in that view is someone looking for what you offer without knowing you exist. That is your SEO target list. If non-branded impressions are flat while branded impressions grow, your SEO is not expanding your reach. It is serving people who already know you. exact day something shifted. Useful for trends; deeply unhelpful when your developer asks “but did the deploy cause the drop?
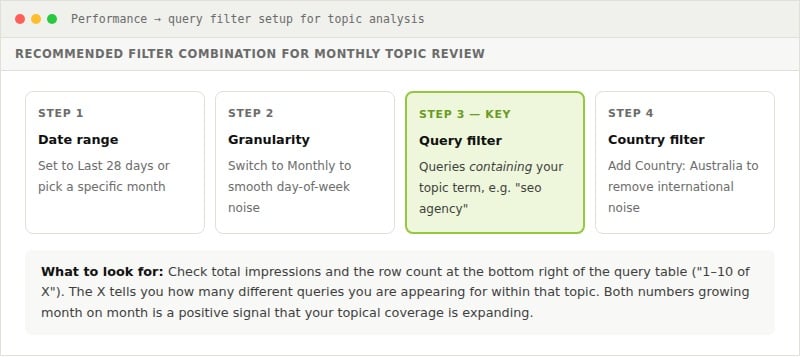
Using the Query Filter to Track Topic Authority
Most people use the Performance report to look at individual queries. You can also zoom out and analyse how your site performs across an entire topic. Most businesses never try it. Which, honestly, is good news for the ones that do.
Instead of a specific keyword, filter by a broad topic term: “seo agency”, “google ads”, whatever your business covers. GSC shows you every query containing that phrase, with combined impressions, clicks, and positions across all of them.
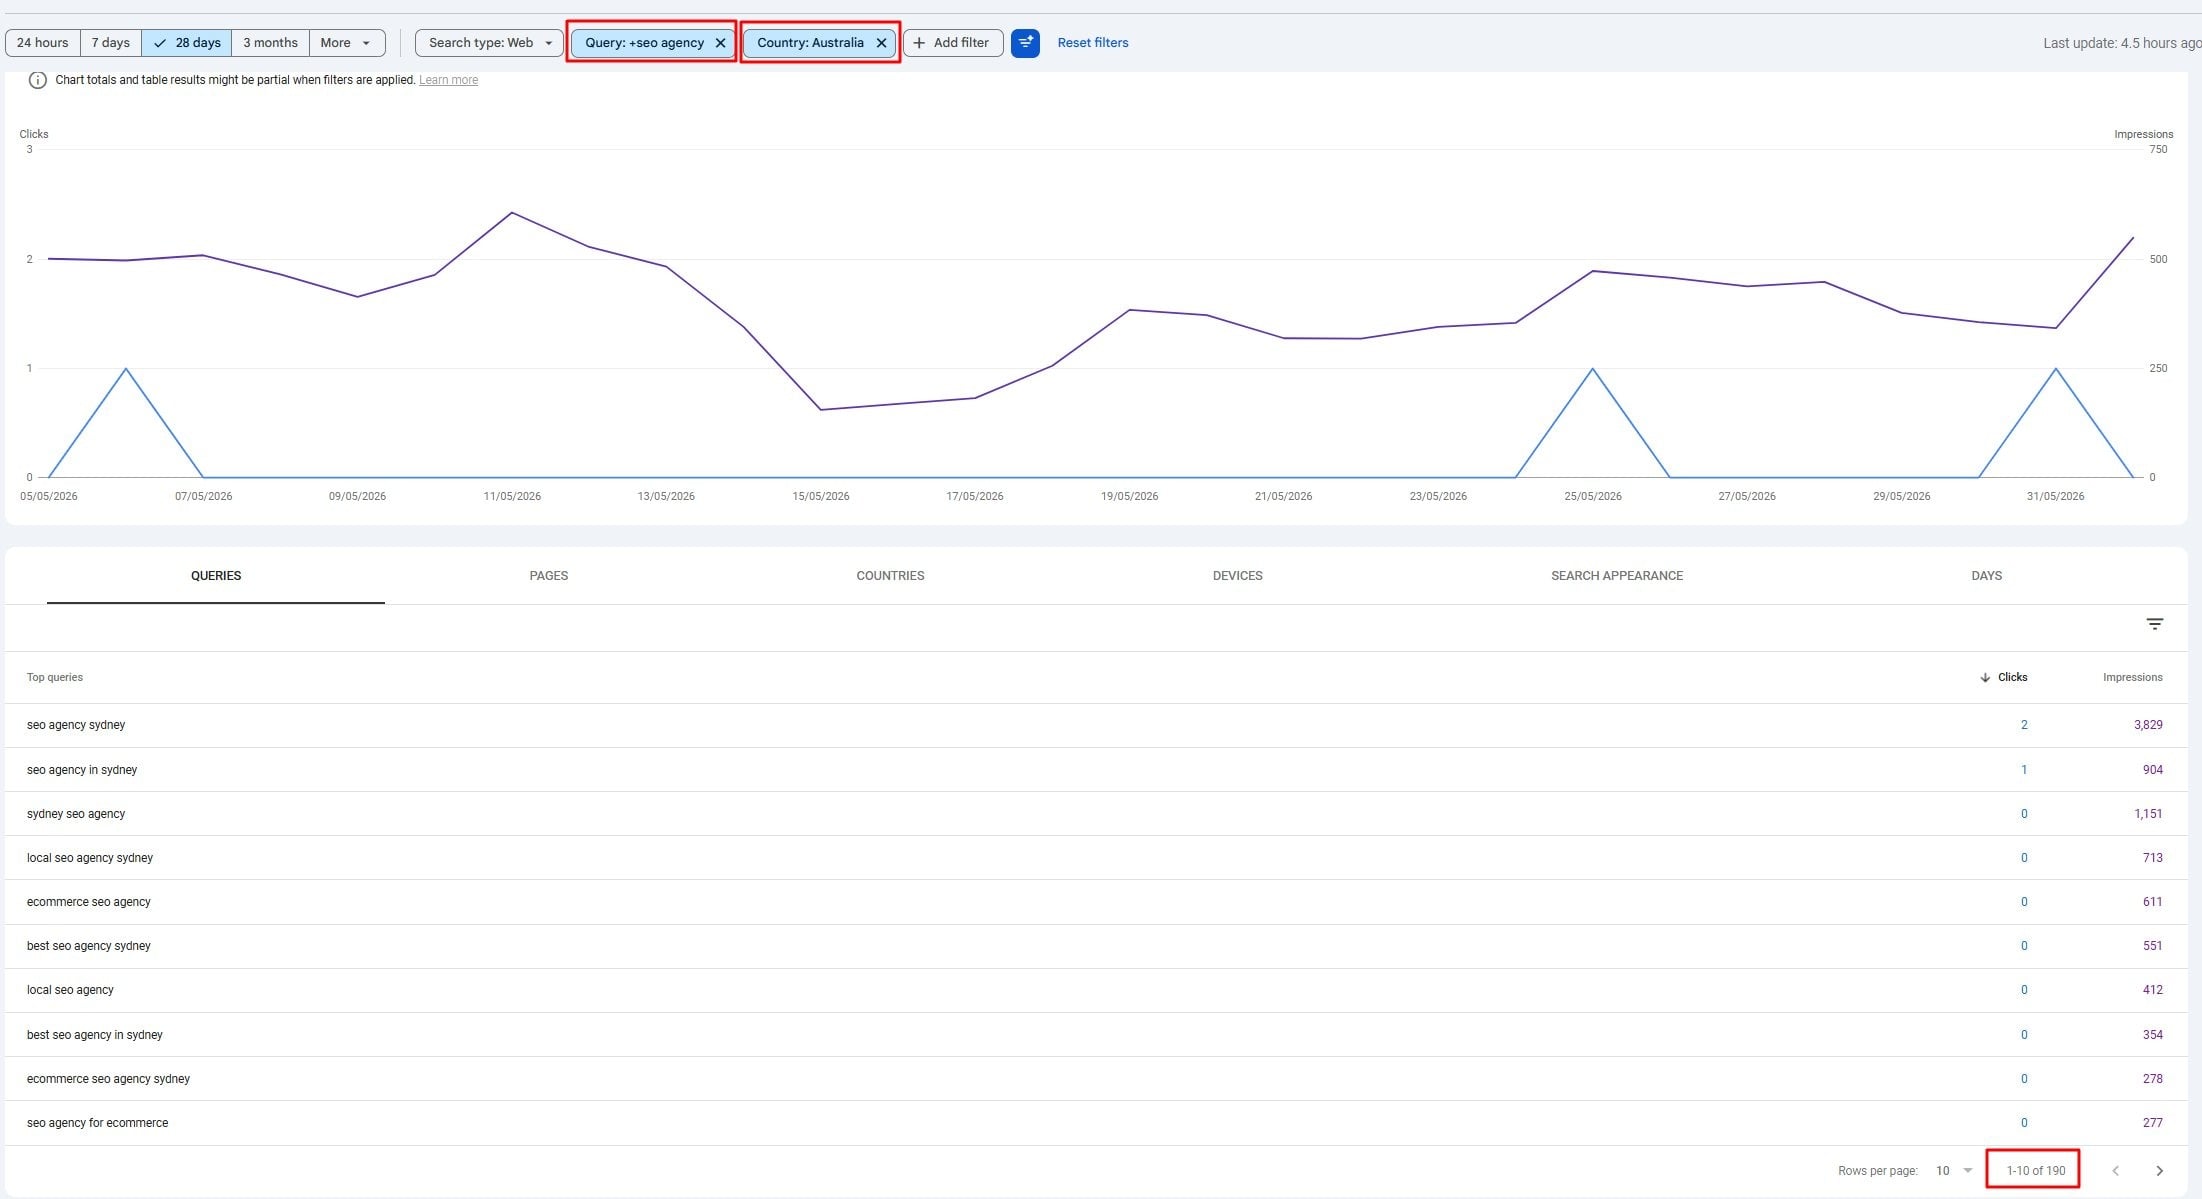
In the screenshot above, filtering for “seo agency” in Australia over 28 days surfaces 190 queries. Each row is a different way someone searched that topic. The filter is set to “Queries containing” rather than exact match. That is what captures the full range.
Why impressions matter more than clicks here
Focus on impressions first. Clicks depend on your position and how compelling your listing is. Impressions are more fundamental: they tell you whether Google considers your site relevant to that topic at all.
Growing impressions month on month means Google is matching your site to a broader range of queries on that topic. That is topical authority building.
Flat or declining impressions? Ask whether you have published enough depth, whether competitors have pulled ahead, or whether your internal linking is signalling the topic matters.
How to run a topic review month by month
Switch to 28-day range, Monthly granularity, add the query filter for your topic, add Country: Australia, then use Compare dates to look at months side by side. You want total impressions and total query count both moving up.
What the data does and does not tell you
Useful directional context, not gospel. Before you fire your SEO agency because impressions dipped in January, consider the following.
Seasonality. A drop in impressions for “tax accountant sydney” in July is expected. Compare the same month year on year, not consecutive months.
AI Overviews. When one fires for a query, organic listings get fewer clicks and sometimes fewer impressions. Impressions holding steady while clicks fall often means AI Overviews are absorbing the traffic, not a rankings problem.
Reduced search demand. If the whole market is searching less for a term, impressions fall regardless of your rankings. Check SEMrush or Google Trends to separate a you problem from a market problem.
Site issues. Downtime, slow server responses, or crawlability problems can suppress impressions sharply. Cross-reference impression dips against your crawl stats to rule this out.
GSC data limitations. Known delays, occasional reporting discrepancies, the 1,000 query cap on exports, and historical bugs that distort data. Trends are directional. Any single data point should not be treated as gospel.
THE MOST USEFUL QUESTION THIS ANALYSIS ANSWERS
“Is Google treating my site as a credible source for this topic, and is that growing or shrinking?” That framing shifts the focus from chasing individual positions to building the kind of topical depth that compounds over time.
The URL Inspection Tool
If a specific page is not ranking where you expect, or you have just made major changes and want Google to recrawl, this is your first stop.
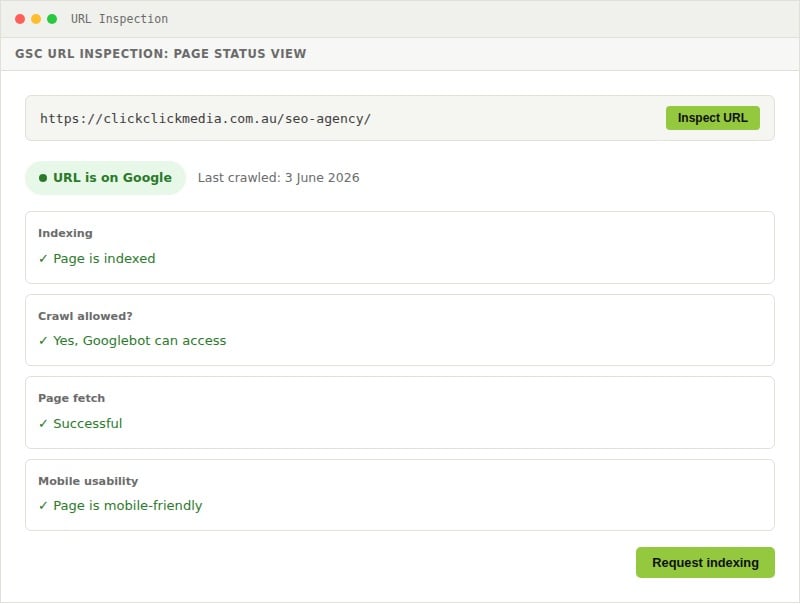
Use it after publishing new pages, fixing a technical issue, or adding schema markup. Hit Request Indexing to queue the URL. Most pages are processed within hours to a few days. If it takes longer, that is Google’s schedule, not yours.
Indexing: Making Sure Google Can Find Your Pages
Go to Indexing → Pages. Google splits all known URLs into four groups:
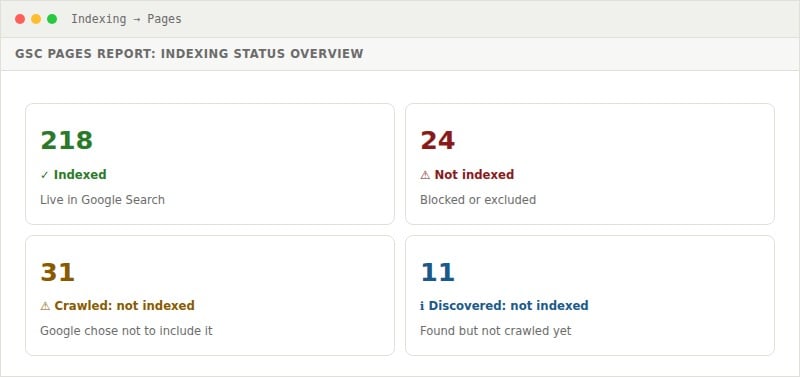
Crawled: currently not indexed is the most important to investigate. Google found and read the page but chose not to include it. Common causes: thin content, near-duplicates, or pages Google has decided do not earn a spot in its index. Hard to argue with a search engine.
Submitting a sitemap (Indexing → Sitemaps) tells Google which pages you want found. Your sitemap is usually at yourdomain.com.au/sitemap.xml. WordPress with Yoast or RankMath generates one automatically. Submit once, resubmit after major structural changes.
The Insights Report
The Insights report is a newer addition to GSC. Most accounts have it. Most people ignore it. Quick read on search performance without opening the full Performance report.
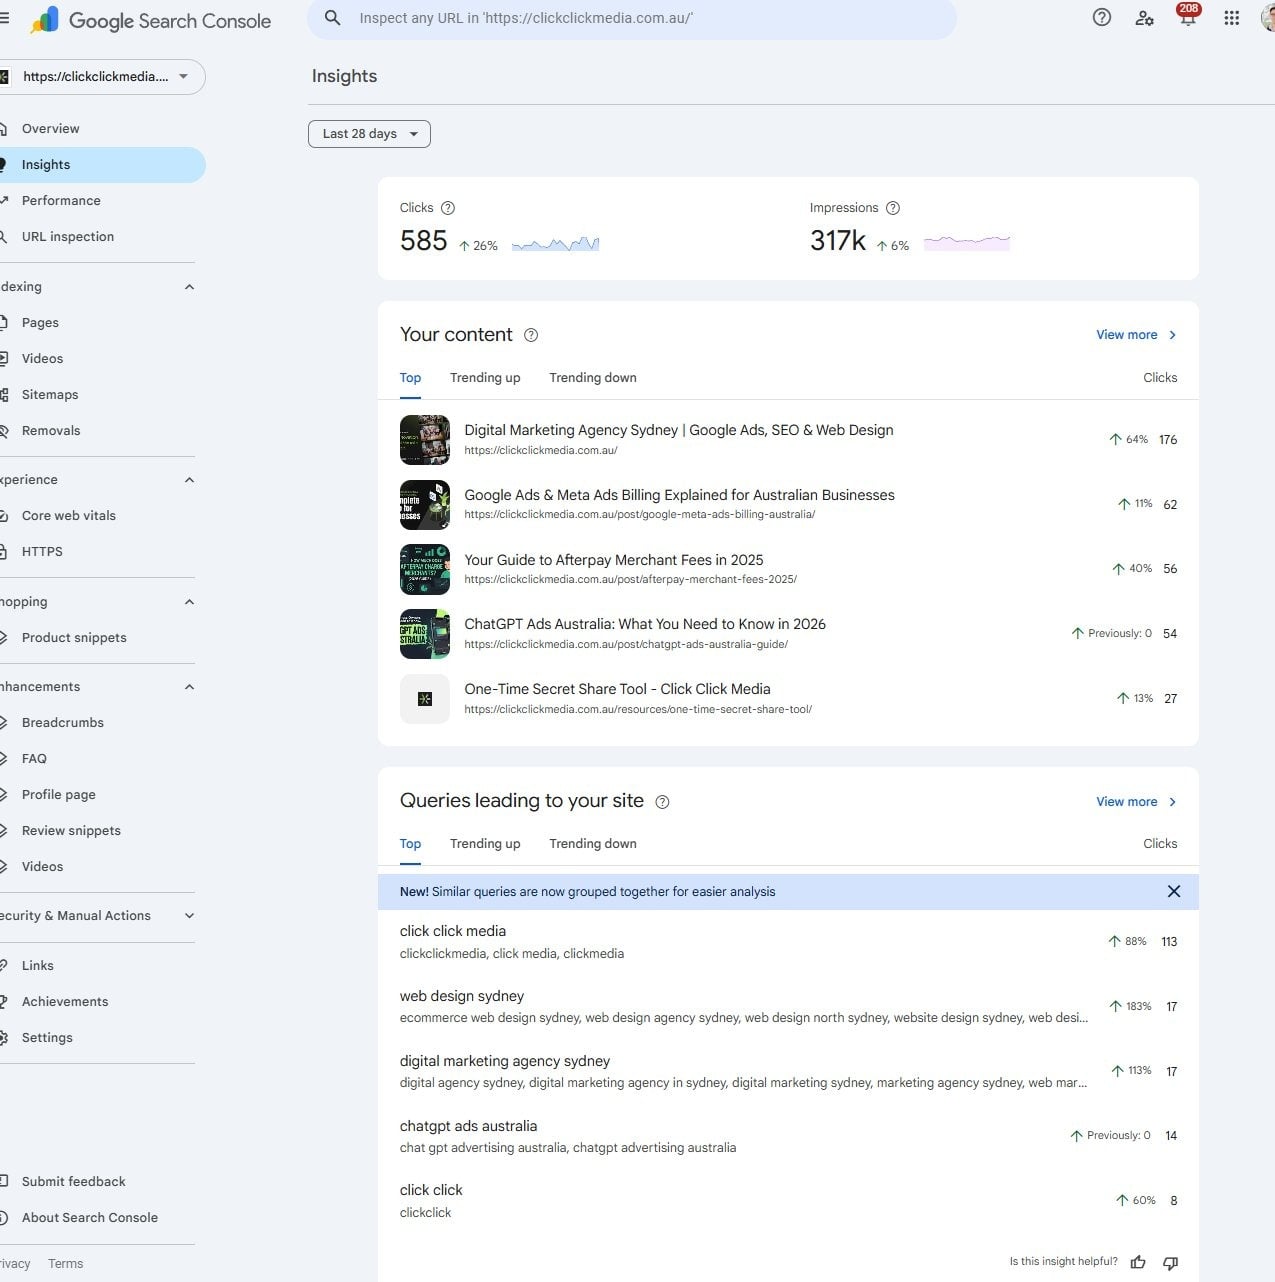
Three things it surfaces that would otherwise require manual filtering:
Your content: Top-performing pages with thumbnail previews. Switch between Top, Trending up, and Trending down. The Trending down tab is the most useful. Nobody wants to check it. Check it anyway.
Queries leading to your site: Similar queries are now grouped together. Instead of reading hundreds of individual rows, you see the topical clusters at a glance.
Clicks and impressions at a glance: Trend arrows and percentage changes over the selected period. No need to open the full Performance report.
HOW TO USE INSIGHTS WEEK TO WEEK
Make it a weekly five-minute habit. Trending down first. Pages slipping need attention before they fall further. Then scan grouped queries for keyword clusters you did not intentionally target. These often surface content opportunities you had not considered. Also watch for AI-generated search results pulling clicks from your top pages. Steady impressions but falling clicks is often the signal.
Core Web Vitals and Page Experience
Google uses page experience signals as ranking factors. Three metrics, measured from real Chrome user data.
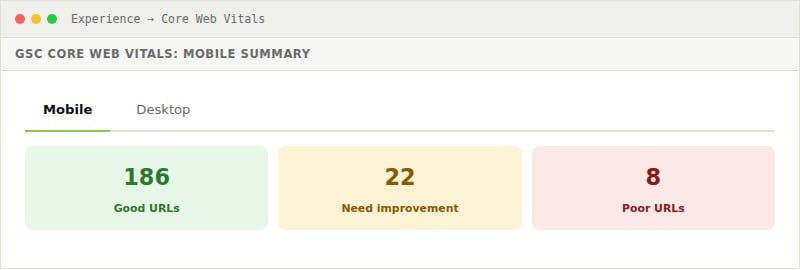
Largest Contentful Paint (LCP): How long until the biggest visible element loads. Target: under 2.5 seconds. Most AU sites fail this on mobile. A 4MB photo of a smiling handshake doing nobody any favours.
Interaction to Next Paint (INP): How quickly the page responds to clicks or taps. Target: under 200 milliseconds. Usually a JavaScript issue.
Cumulative Layout Shift (CLS): Measures how much elements shift while loading. Target: below 0.1.
MOBILE-FIRST INDEXING
Google ranks your site based on its mobile version. Poor mobile Vitals affect desktop rankings too. Always check Mobile first
Crawl Stats: Understanding How GoogleExplores Your Site
Crawl stats is tucked under Settings, not the main nav. Google hid the good stuff. Worth finding.
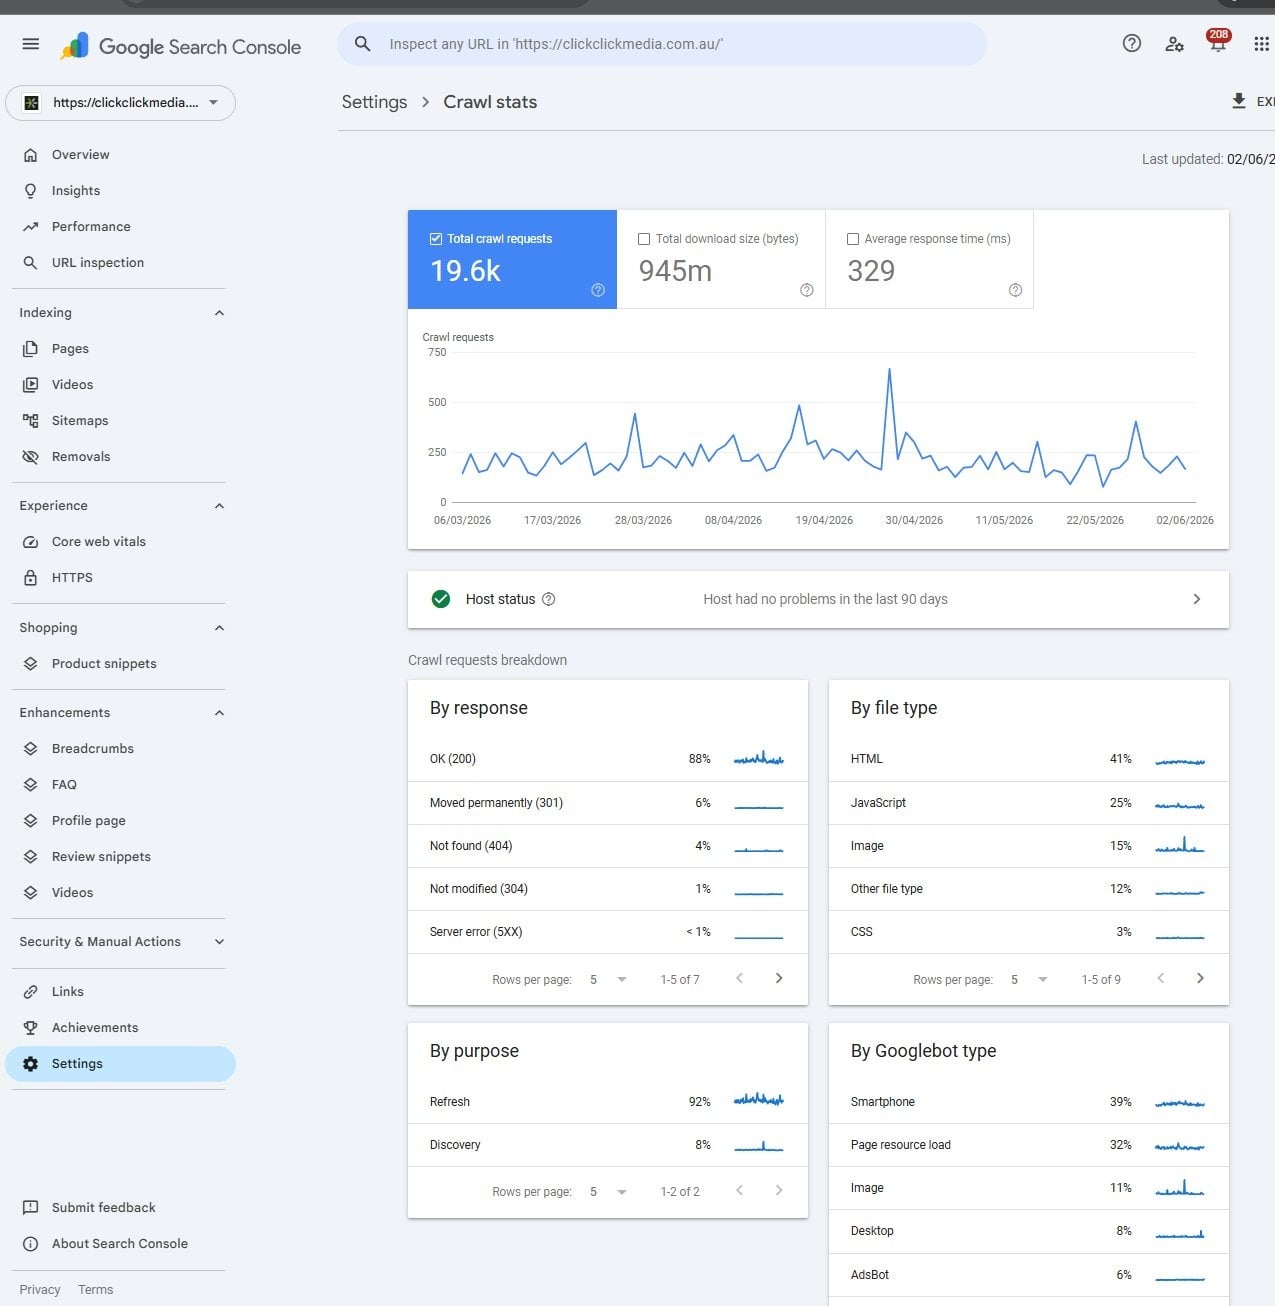
Here is how to read the key sections:
Total crawl requests
The total requests Googlebot made to your server in the last 90 days. Higher means Google treats your site as active and worth visiting regularly. A sudden drop can signal availability issues. A spike can follow major link acquisition or a viral content moment.
By response
What Google received when it made those requests:
- OK (200) at 88%: That is what you want to see.
- Moved permanently (301) at 6%: Moderate is fine. A very high percentage suggests redirect chains that need cleaning up.
- Not found (404) at 4%: Google is hitting dead pages. It will keep visiting them, hopefully, until it gives up. Clean them up via the Pages report.
- Server error (5XX) below 1%: Occasional server errors are normal. Persistent 5XX errors point to a hosting or infrastructure problem that will affect rankings.
By file type
HTML should dominate. If JavaScript or images are consuming a disproportionate share, your site structure is not directing Google’s attention to your most important pages first.
By Googlebot type
Smartphone is the dominant crawler in the CCM example. That is the one Google uses to evaluate your site for rankings. If your mobile experience is slow, your rankings will show it.
WHAT CRAWL STATS REVEALS THAT THE PAGES REPORT DOES NOT
The Pages report tells you whether pages are indexed. Crawl stats tells you whether Google can reach them efficiently. Low crawl volume, high 404 rate, or Googlebot spending time on non-HTML files are all signals worth acting on. For larger sites, crawl budget management is a real ranking factor.
The Links Report
Backlinks are one of Google’s strongest ranking signals. The Links report shows who links to you, which pages earn the most, and how your own pages link internally.
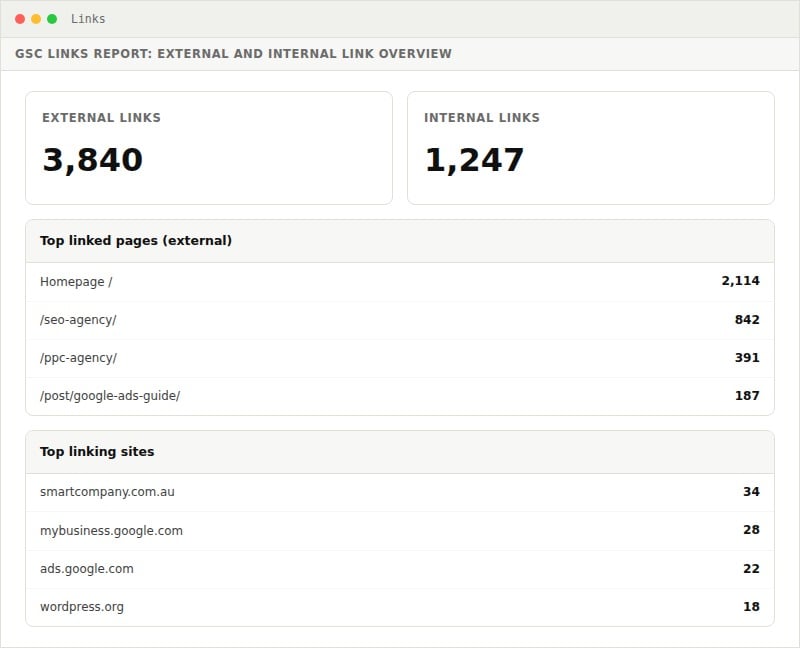
If your homepage is the only page with meaningful external links and your service pages have earned none, that is a content problem worth fixing. Pages that attract links rank more reliably.
More internal links to a page tells Google it matters. If your homepage has 200 internal links and your best service page has three, that is a fixable problem requiring no external work at all. Just a bit of embarrassment and a spreadsheet.
Linking Google Search Console to Google Analytics 4
Connecting GSC to GA4 puts search query data inside Google Analytics. You can see the full journey from search term to on-site behaviour, conversions, and revenue.
Two combined reports become available inside GA4:
Google organic search queries: Shows which queries drove sessions alongside GA4 engagement data. A query sending 200 visitors with zero conversions tells you something very different from a query sending 20 visitors with 10 conversions. Traffic is not the goal. It just gets confused for the goal surprisingly often.
Google organic search traffic by landing page: Combines GSC click data with GA4 behaviour by landing page. Identifies which organic pages engage visitors and which bounce despite good rankings.
WHY THIS MATTERS MORE THAN USING EITHER TOOL ALONE
GSC tells you what people searched. GA4 tells you what they did after they clicked. Combined, you can see which rankings actually drive business and which are just traffic with no value. That is the data that justifies SEO investment to a CFO.
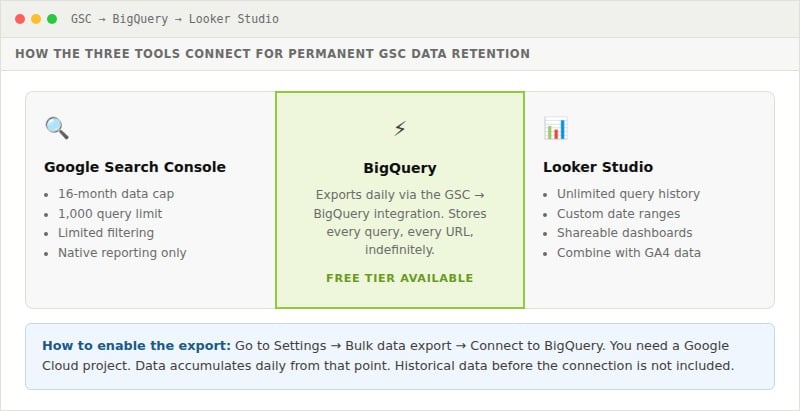
Storing GSC Data Permanently with BigQuery and Looker Studio
Two limits most businesses hit eventually: 16 months of data and a 1,000 query cap per date range. For high-traffic sites or long-running programmes, both matter.
The solution is to connect Google Search Console to BigQuery (Google’s cloud data warehouse) and analyse the exported data in Looker Studio (formerly Google Data Studio). Once set up, it stores your GSC data permanently, removes the 1,000 query limit, and lets you build custom dashboards that go well beyond what the native GSC interface allows.
What you can do with BigQuery + Looker Studio that you cannot do in GSC alone
Query data beyond 1,000 rows: GSC’s native Performance report shows your top 1,000 queries per date range. For sites targeting hundreds of long-tail keywords, a portion of your search traffic is invisible in the standard interface. BigQuery exports everything.
Permanent historical data: Once connected, your data accumulates indefinitely. Year three compared against year one. Seasonal patterns across multiple years. The 16-month rolling window in GSC makes that impossible.
Custom reporting and dashboards: Looker Studio connects directly to your BigQuery dataset and lets you build dashboards tailored to how your business reports on SEO. You can combine GSC data with GA4 conversion data, Google Ads campaign data, or any other source in one shared report.
Granular filtering and segmentation: BigQuery lets you write SQL queries against your GSC data. Analyse specific URL patterns, query clusters, or time windows with a precision the native interface cannot match.
IS BIGQUERY RIGHT FOR YOUR BUSINESS?
BigQuery earns its place when you need year-on-year comparison beyond 16 months, the 1,000 query limit is hiding meaningful data, or you need GSC combined with other data sources in one view. Not sure if you are hitting the 1,000 query cap? Export 12 months to a spreadsheet and check whether the last rows still show meaningful impressions. If they do, you are capped.
Domain Property and the Disavow Tool
One limitation of the Domain property: the Google Disavow Tool does not support it.
The Disavow Tool tells Google to ignore specific backlinks when evaluating your link profile. Use it when you have harmful links you cannot get removed by contacting the linking site. The tool only works with URL prefix properties. If you set up GSC as a Domain property and later need it, create a separate URL prefix property, verify it, and submit the disavow file through that.
The Disavow Tool tells Google to ignore specific backlinks when evaluating your link profile. Use it when you have harmful links you cannot get removed by contacting the linking site. The tool only works with URL prefix properties. If you set up GSC as a Domain property and later need it, create a separate URL prefix property, verify it, and submit the disavow file through that.
SHOULD THIS CHANGE YOUR PROPERTY TYPE DECISION?
For most Australian businesses, no. Google has reduced the weight of spammy links considerably and the tool is rarely needed. Mostly used by people who bought links in 2012 and are still paying for it. The Domain property is still the right choice. But if you are dealing with a penalty, a negative SEO attack, or a historically problematic link profile, set up a URL prefix property alongside it so you have disavow access if you ever need it.
Finding SEO Opportunities in Your Data
1. Find pages stuck just off page one
In the Performance report, filter by average position between 8 and 20. These are your almost-there pages: ranking, visible, generating impressions, but sitting one or two spots outside where the clicks actually go. More content depth, stronger internal links, a better title: any of these can push them into the top five where CTR jumps.
2. Fix high-impression, low-CTR pages
Sort the Queries tab by Impressions descending. Look for rows with CTR below 3 to 5 percent. The listing is bland and your competitor’s is not. Rewrite the title and meta description around a specific benefit. No ranking change required. Just better copywriting.
3. Use Insights to catch declining content early
Check the Trending down tab in the Insights report weekly. Pages with some ranking history are far easier to rescue than building new ones. Update the content, refresh the statistics, add new sections.
4. Audit non-branded queries for content gaps
Apply the non-branded query filter and sort by Impressions. Every query in that view is someone searching for what you sell, without knowing your name. High impressions, few clicks, or positions 12 to 20: those are your priorities.
5. Use crawl stats to catch technical issues early
A rising 404 rate means Google is burning crawl budget on dead ends. A rising 5XX rate flags server reliability. Catch these early, before they compound into ranking problems. GSC is one of the few tools that surfaces this kind of signal in real time.
FAQs
What is Google Search Console and what does it do?
Free tool from Google that shows how your website performs in search. It reports on indexed pages, clicks, impressions, queries driving traffic, and whether technical problems are affecting your visibility.
Is Google Search Console free?
Yes, completely free. Any verified website owner can access it at no cost.
How do I add a sitemap to Google Search Console?
Go to Indexing → Sitemaps, enter your sitemap URL (usually yourdomain.com.au/sitemap.xml), and click Submit. WordPress with Yoast SEO or RankMath generates one at /sitemap_index.xml. Resubmit after major site restructures.
How do I give someone access to Google Search Console?
Go to Settings → Users and permissions. Click Add user and enter their Google account email. Choose Full access (can manage settings) or Restricted access (view only). Add your SEO agency as a user rather than sharing login credentials.
What is the difference between Daily, Weekly, and Monthly view?
Granularity controls for the Performance chart. Daily: best for pinpointing when a change happened. Weekly: smooths day-of-week noise, good for trend analysis over a few months. Monthly: best for long-term trends and year-on-year comparisons.
What is the difference between branded and non-branded queries?
Branded queries include your business name. Non-branded queries are searches for services you cover without any reference to your brand. Filtering to non-branded isolates your true SEO performance: the traffic from people who did not already know to search for you by name.
Can I use the disavow tool with a domain property?
No. The Disavow Tool only works with URL prefix properties. Create a separate URL prefix property, verify it, and submit the disavow file through that. Most businesses will never need it.
How do I check keyword rankings in Google Search Console?
Go to Performance → Search results and click the Queries tab. Sort by Average Position to see your best-ranking keywords, or by Impressions to see where you appear most often.
How do I link Google Search Console to Google Analytics 4?
In GA4, go to Admin → Search Console links under the Property column. Click Link, select your verified GSC property, choose your web data stream, and confirm. Search query data then appears in Reports → Acquisition → Search Console.
What does crawl stats tell me that the Pages report does not?
The Pages report tells you whether pages are indexed. Crawl stats tells you whether Google can reach them efficiently: how many requests succeed, what file types consume crawl budget, and which Googlebot types are most active.
How do I store more than 16 months of GSC data?
Connect GSC to BigQuery using Settings → Bulk data export. Once connected, GSC exports daily data indefinitely, removing both the 16-month cap and the 1,000 query limit. Connect that dataset to Looker Studio for custom dashboards.
How do I add annotations to Google Search Console?
Right-click any date on the Performance report chart (or Ctrl+click on Mac) and select Add annotation. Add a note up to 120 characters and click Add. They appear as markers on the chart timeline, visible to all users with property access. Cannot be edited after saving, only deleted and re-added. Auto-delete after 500 days. Feature launched November 2025.
Can I use GSC to track how my site performs for a whole topic?
Yes. In the Performance report, click Add filter, select Query, choose “Queries containing”, and enter a broad topic term. GSC shows every query containing that phrase with combined impressions, clicks, and positions. Add Country: Australia and switch to Monthly granularity to compare topic-level performance month by month. Watch impressions first.
Want Someone to Read Your Search Console Data for You?
Google Search Console tells you what is happening. Most businesses collect the data, nod thoughtfully, and then do not quite get around to acting on it. Click Click Media (CCM) has been helping Australian businesses grow organic traffic since 2008. A free SEO audit covers your Search Console data, your keyword opportunities, and where you are losing ground to competitors.
No lock-in contracts • 92%+ client retention • Norwest, Sydney NSW