TL;DR
Google Trends shows relative search interest (0-100 scale), not absolute volumes. Use it for direction and momentum, not as a replacement for keyword tools.
Always filter to Australia — global data is US-dominated and does not reflect local demand patterns.
Biggest opportunity: Rising queries surface keyword ideas before they appear in volume-based tools. Publish seasonal content 6-8 weeks before the peak.
Pair with SEMrush or Google Keyword Planner to confirm absolute search volumes before committing to content.
Google Trends is one of the most honest tools in a marketer’s kit. It shows you what people are actually searching for, not what they claim to want. Free, updated in near real-time, and filterable down to individual Australian states.
Most guides to Google Trends walk you through the interface and stop there. This one goes further: how to read the data correctly, where the tool misleads you, and how to apply it practically to SEO, content planning, and competitor research in an Australian context.
What is Google Trends?
Google Trends launched in 2006. It analyses a sample of Google searches to show the relative popularity of search terms over time. Unlike a keyword research tool or search engine results page, it shows momentum rather than snapshot volume. The key word is relative. The tool does not show raw search volume. It shows how interest in a term compares to its own peak, and optionally how it compares to other terms in the same search.
Every data point is a number between 0 and 100. A score of 100 represents the highest search interest in the selected time period. A score of 50 means interest was half what it was at peak. A score of 0 means the term had too few searches to register.
Why this matters for Australian businesses
Google Trends defaults to worldwide data. Worldwide data is dominated by the US, which has roughly 13 times Australia’s population. A search term that peaks in December globally (Christmas shopping) might peak at a completely different time in Australia, or not show up at all if Australian search volume is low relative to global volume. Always filter to Australia before drawing any conclusions.
What Google Trends is useful for:
- Understanding whether interest in a topic is growing, declining, or stable
- Identifying seasonal demand patterns for your industry
- Comparing the relative popularity of competing terms or brands
- Finding breakout queries before they reach peak volume
- Validating content ideas before investing time in them
- Understanding geographic variation in search interest across Australian states
What it is not useful for:
- Finding exact monthly search volumes (use SEMrush or Google Keyword Planner for that)
- Researching low-volume niche keywords (they will not appear)
- Real-time data (there is a 24 to 72 hour lag in most views)
Keyword landscape for this topic in Australia (2026)
Before using Google Trends to research other topics, it helps to understand how Australians search for Google Trends itself. The data below is from SEMrush AU, pulled June 2026.
| Keyword | Monthly searches (AU) | Difficulty | CPC |
|---|---|---|---|
| google trends | 33,100 | 80 | $3.62 |
| google trends australia | 1,300 | 50 | $3.60 |
| how to use google trends | 30 | Low | — |
| what is google trends | 20 | Low | — |
| google trends for seo | 20 | Low | — |
| google trends comparison | 20 | Low | — |
| how accurate is google trends | 20 | Low | — |
| trending searches on google | 110 | Low | — |
The primary term “google trends” is highly competitive at KD 80 and almost entirely navigational. The informational queries (how to use it, what it is, accuracy) have very low difficulty and are the realistic traffic opportunity for an educational guide like this one.
The Google Trends interface explained
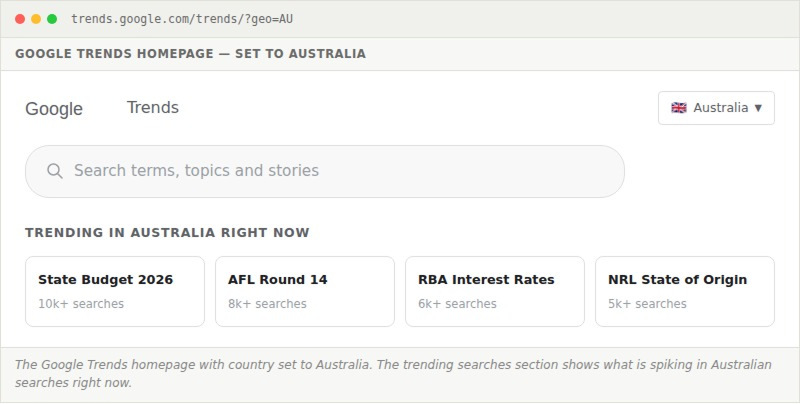
Go to trends.google.com and you land on the Trends homepage. Set your country to Australia in the top-right before doing anything else.
The homepage shows trending searches in real-time. These are topics with recent significant spikes in search volume, not necessarily high overall volume. They are useful for reactive content, though not much else.
Type a search term into the search bar and Google Trends switches to the Explore view, which is where all the analytical value sits.
The Interest Over Time graph
This is the central chart in Google Trends, and where you will spend most of your time. It shows a line graph of relative search interest over your selected time period.
Reading the Interest over Time graph correctly requires understanding a few things that trip people up:
The scale is relative, not absolute. The peak month always scores 100. If your term had low search volume in January and high volume in July, January might score 8 even if the absolute number of searches was reasonable. You cannot use these numbers to estimate actual search volumes.
Flat lines near zero do not mean no searches. They mean the term does not have enough volume to register meaningfully in the sample. This is common for very niche or localised terms.
Spikes can indicate news events, not genuine demand. A sudden spike that disappears within days is almost always a news cycle, not a trend. Look for sustained upward movement when trying to identify genuine demand growth.
The 5-year view is your best starting point
Most people default to 12 months. Switching to 5 years immediately shows you whether a topic is growing, stable, or declining over time, and reveals seasonal patterns you cannot see in a 12-month window. For most strategic decisions, start at 5 years and zoom in from there.
Filters: region, time, category, and search type
Below the search bar in the Explore view, four filter controls shape the data. Getting these right matters more than most people realise.

Region filter
Set to Australia for any Australian business decision. Within Australia, you can also filter to individual states (New South Wales, Victoria, Queensland, etc.) which is useful for local SEO and campaign planning. This is covered in more detail in the Geographic Interest section below.
Time range filter
The available options are: Past hour, Past 4 hours, Past day, Past 7 days, Past 30 days, Past 90 days, Past 12 months, Past 5 years, and 2004 to present. There is also a custom range option.
| Time range | Best used for |
|---|---|
| Past hour / 4 hours | Real-time monitoring of breaking news or viral moments |
| Past 7 to 30 days | Reactive content planning; understanding what is trending right now |
| Past 12 months | Annual seasonal patterns; content calendar planning |
| Past 5 years | Long-term growth or decline trends; strategic decisions |
| 2004 to present | Very long-term perspective; established seasonal patterns |
Category filter
Filtering by category can disambiguate terms with multiple meanings. Searching for “python” without a category returns a mix of programming and wildlife searches. Filtering to Computers & Electronics makes it clearly about the programming language. Use this when your keyword is a common word with multiple interpretations.
Search type filter
Beyond Web Search, you can analyse interest from Image Search, News Search, Google Shopping, and YouTube Search. This is useful for understanding channel-specific behaviour. A product might trend strongly in Shopping Search ahead of trending in Web Search, giving you early signal before competitors notice.
The Gemini AI side panel
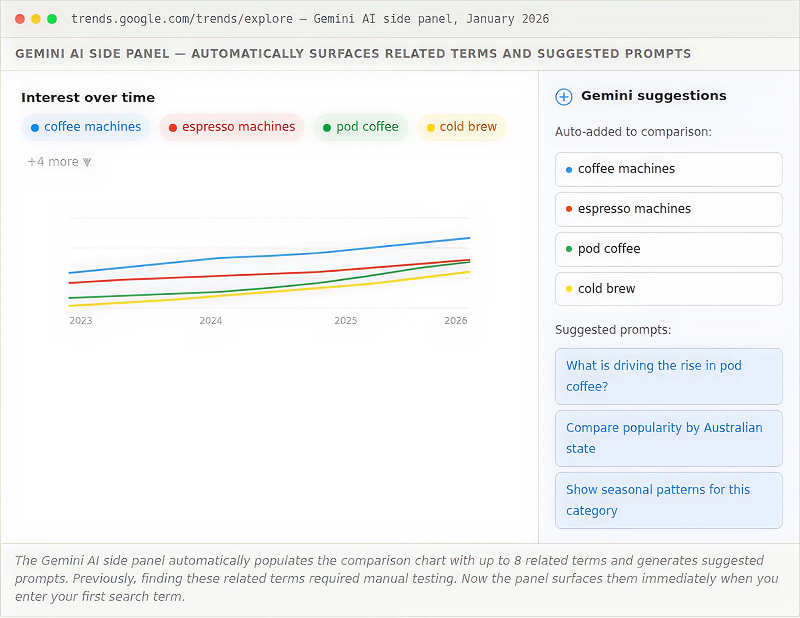
In January 2026, Google redesigned the Trends Explore page with a Gemini-powered AI side panel. It is currently available on desktop and changes how you can explore a topic without manually testing dozens of variations.
When you search for a topic in the new Explore page, the side panel automatically populates the comparison chart with up to eight related search terms. If you search “coffee machines”, it might immediately surface comparisons for espresso machines, pod coffee, french press, and cold brew without you having to type each one. It also generates suggested follow-up prompts so you can go deeper on any angle that looks interesting.
The practical benefit is speed. Finding the right comparison set used to mean opening Google Trends, entering a term, manually guessing related keywords, adding them one at a time, and iterating. The Gemini panel does the first pass automatically. You can still override its suggestions and add your own terms, but for initial exploration of a new topic it removes most of the manual work.
A few things worth knowing about the panel:
- It is currently available on desktop only, not mobile.
- It compares up to eight terms simultaneously, up from the previous five-term limit.
- The interface redesign gives each term a distinct colour and icon, making it easier to track individual lines on a busy chart.
- The suggested prompts use natural language so you can type questions like “what is driving interest in this topic?” rather than needing to know specific keyword combinations.
- The feature is available to all users, not just those with paid Google accounts.
How to use Gemini suggestions for Australian keyword research
Enter a broad topic term related to your business, let Gemini populate the initial comparison set, then add Country: Australia to filter the chart. The related terms Gemini surfaces are often more relevant than the ones you would manually think to compare, particularly for tangential topics that are driving interest in your category. Any term showing strong upward movement in the AU-filtered view is a content opportunity worth taking to SEMrush to confirm volume.
Comparing multiple terms
The comparison feature is where Google Trends becomes one of the most useful features for business decisions. You can compare up to five terms simultaneously, and because all terms are normalised to the same 0–100 scale, the relative popularity is immediately visible.
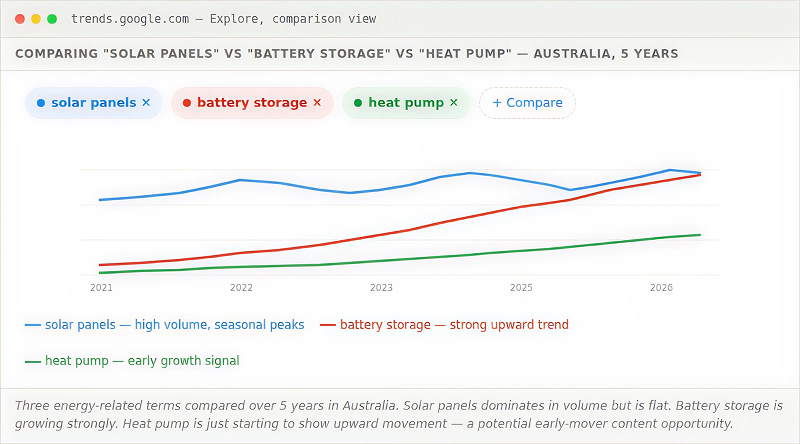
The comparison view tells you three things at once: which term has the highest relative volume, which is growing fastest, and whether any terms are correlated (they tend to move together) or independent.
Practical uses for comparison
Keyword selection: If you are deciding between two keyword targets, comparison shows which one Australian audiences are actually searching more. Important caveat: the more popular term is not always the better target. A rapidly growing but lower-volume term can be easier to rank for and may be worth targeting earlier.
Brand vs competitor research: Compare your brand name against a competitor to see relative awareness trends over time. If their name is growing faster than yours, that is a market signal worth understanding. Cover this more below in the competitor research section.
Product category decisions: A business deciding whether to invest in content around “electric vehicles” vs “hybrid cars” vs “hydrogen cars” in Australia can immediately see which one has the most meaningful and growing search interest.
The comparison trap to avoid
Comparing terms with very different volume levels can be misleading. If Term A gets 50,000 searches a month and Term B gets 100, the chart will show them as more comparable than they actually are. Use Google Trends comparison for directional insight, then check absolute volume in SEMrush or Google Keyword Planner before making final decisions.
Geographic interest across Australia
Below the Interest over Time graph sits the Interest by Region map. For Australian businesses, this is one of the most practically useful features in the tool.
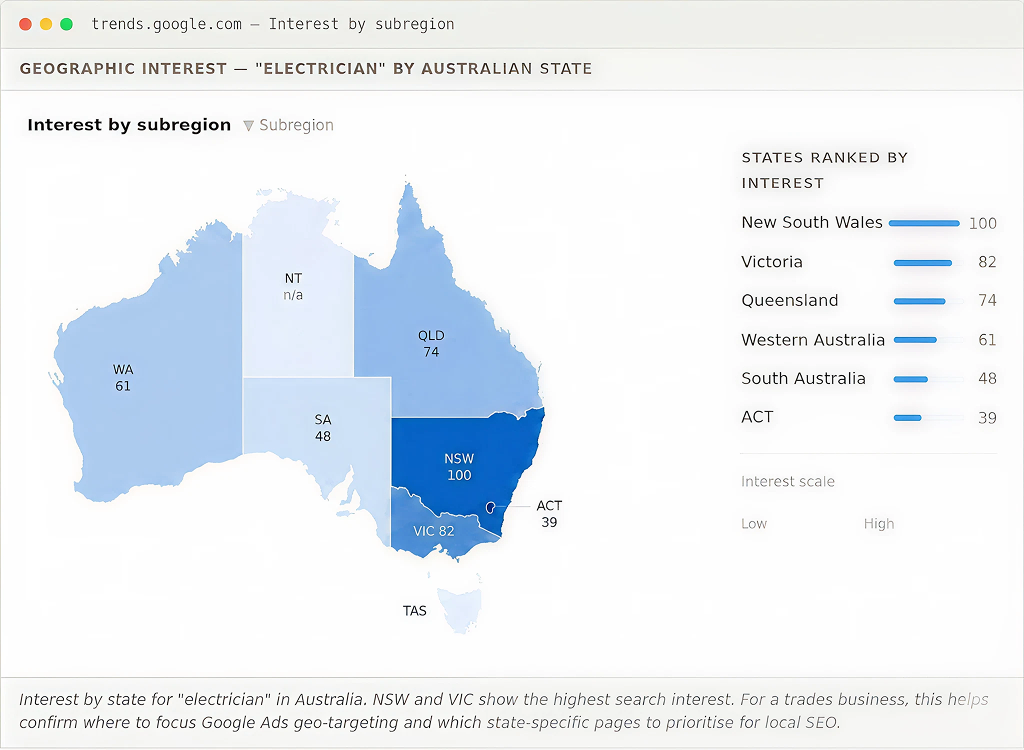
The geographic view is useful for several practical decisions:
- Google Ads geo-targeting: If you service multiple states, the geographic data shows where demand is strongest, which should influence how you allocate ad budget across regions.
- Local SEO priorities: If you are building state-specific landing pages, the data tells you which states have the most search demand and should be prioritised first. This aligns directly with local SEO strategy for multi-suburb businesses.
- Market expansion decisions: A business considering expanding from Sydney to other markets can check whether search demand for their category is strong in those states.
- Content localisation: Topics that are strong in certain states may warrant state-specific content variations.
Related queries and topics
Scroll below the geographic map and you find the two sections most people ignore: Related topics and Related queries. These are gold for keyword research and content planning.
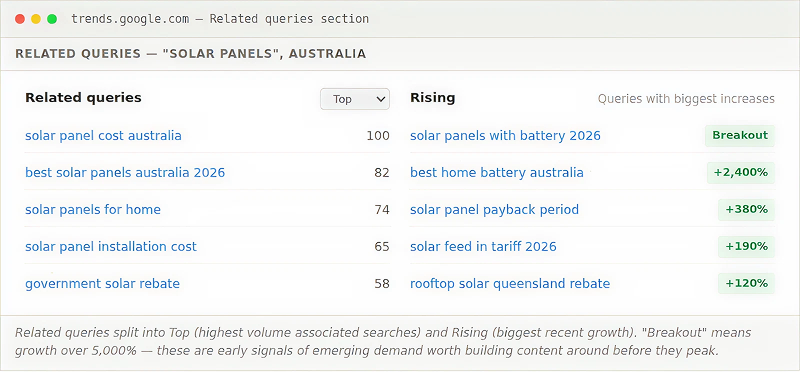
Top queries vs Rising queries
Top queries show the search queries most strongly associated with your topic by volume. These are established patterns. They tell you what people want to know when they search for your topic, which is invaluable for content structure and FAQ development.
Rising queries are where competitive advantage lives. These are terms with recent significant growth. A “Breakout” label means growth of over 5,000 percent. If a rising query is related to your business and you produce strong content on it now, before the volume peaks, you can own a position before competition arrives.
The distinction between Related topics and Related queries is also worth understanding. Topics are broader thematic categories Google associates with your search. Queries are specific search strings. Topics help you understand the adjacent concepts people connect to your term; queries help you build a direct keyword list.
Spotting seasonal demand in Australia
Australian seasonal patterns often differ considerably from global ones. This matters for any business that imports content strategy from US sources.
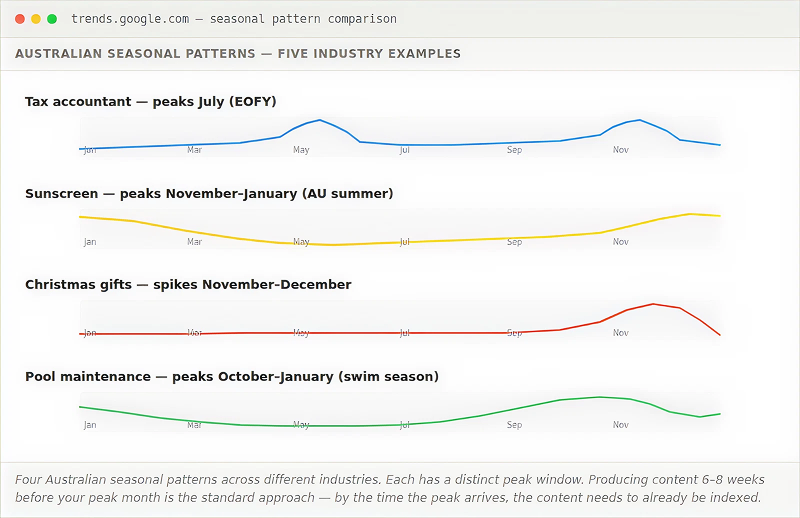
Key Australian search trends worth knowing:
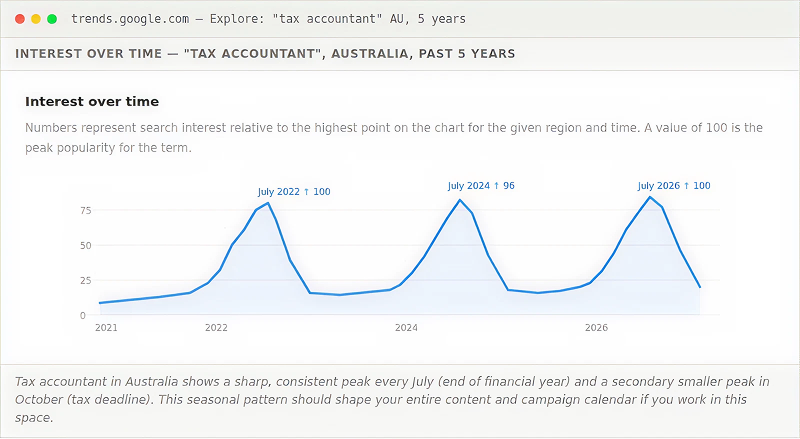
- Financial year end (June–July): Peaks for tax, accounting, depreciation, work expenses, and small business deductions.
- Summer (November–January): Peaks for sunscreen, outdoor furniture, pool maintenance, air conditioning, and holiday activities.
- Back to school (January): Peaks for school supplies, uniforms, tutoring, and laptops.
- Easter (March–April): Peaks for travel, chocolate, and family activities.
- AFL and NRL finals (September): Peaks for sport-adjacent searches in relevant industries.
The content timing rule
This is especially important for Australian businesses building a local SEO strategy using Google Trends Australia filters: seasonal peaks here differ from global calendars, so US-sourced content schedules will not match your audience. Publish seasonal content 6 to 8 weeks before the peak. Google needs time to crawl, index, and rank your content. If you publish a “best tax deductions for small business” article on July 1, you have missed the search peak entirely. Publish in May and you will be indexed and ranking by the time the peak arrives.
Using Google Trends for SEO
Google Trends is underused as an organic search research tool. Most people use it to confirm what they already knew. Used properly, it can sharpen your SEO strategy before a single word of content is written. Here is how to use it to find things you did not know.
Validate keyword targets before committing
Before building content around a keyword, check its trend line over 5 years. A keyword with declining search interest in Australia is a poor investment even if it shows reasonable volume in a keyword tool today. That volume is shrinking. Conversely, a keyword with lower current volume but a clear upward trend is a better long-term bet.
Find keywords at the start of their growth curve
The Rising queries section under a topic often surfaces keywords before they appear in volume-based keyword tools. SEMrush and similar tools show volume based on recent past data. Google Trends shows momentum in near real-time. A breakout query in Trends may not have enough historical volume to show up in SEMrush yet, but it is on its way. Building content around it now means ranking before competition arrives.
Identify keyword cannibalism risk
If you are creating content across multiple related keywords, Google Trends comparison shows you whether those terms are actually distinct in Australian search behaviour or closely correlated. Highly correlated terms (the lines move identically) may not need separate content pieces, they may be better served by a single comprehensive page.
Understand searcher intent through related queries
The related queries for your focus keyword reveal what else people are searching for when they search for your topic. This is a direct window into searcher intent. If the top related queries for your B2B software term include “vs competitor” and “pricing,” your content needs a comparison section and a pricing section to fully serve that intent.
Check if a topic is worth creating content for at all
Some topics look interesting but have no real search demand in Australia. Google Trends quickly shows you whether Australian audiences are searching for a topic or whether the interest is primarily offshore. A flat or near-zero line in the Australian filter is a clear signal to deprioritise that topic.
Content planning with Google Trends
The most consistent practical application of Google Trends for Australian businesses is content calendar planning. A consistent Google Trends content strategy gives you a data-backed publishing schedule rather than guesswork. Here is the workflow.
List your core content topics. Start with 5 to 10 topics relevant to your business, not specific keywords, but broader subject areas.
Check each topic on 5-year AU view. Is it growing, flat, or declining? Prioritise growing topics. Note seasonal peaks.
Review related queries on Rising view. Capture any breakout or high-growth queries related to each topic. These are your content ideas for the next 6 months.
Map seasonal peaks to your calendar. For each seasonal topic, back-date 8 weeks from the peak to set your publish deadline.
Validate with volume data. Take your shortlist to SEMrush or Google Keyword Planner to confirm actual search volume before committing to writing.
An Australian-specific use case: financial year content
Australian businesses often miss the EOFY content opportunity. Searches for tax deductions, depreciation schedules, business expenses, and accounting services spike sharply in June and July every year without fail. If your business is adjacent to any of these topics (bookkeeping software, vehicle leasing, office equipment, professional services), an EOFY content piece published in April or May can generate recurring traffic every year.
Competitor research with Google Trends
Google Trends lets you compare brand names directly. It is a form of passive market research that requires no survey, no tool subscription, and no data export.
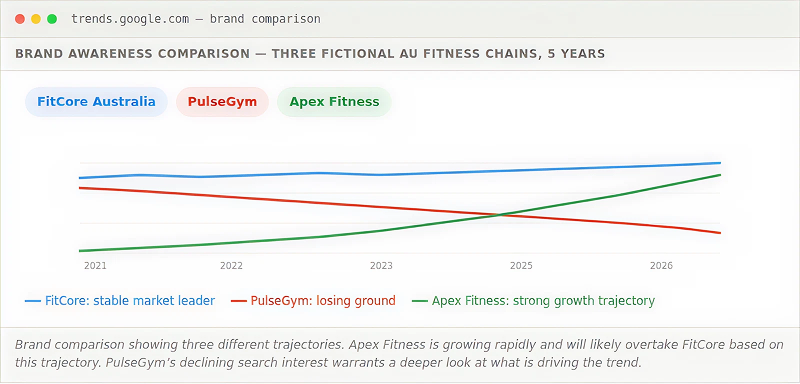
Brand comparison tells you several things at once. A competitor whose brand name is declining in search interest is losing market awareness. A competitor growing rapidly may be gaining market share, investing in marketing, or benefiting from press coverage worth analysing.
You can also compare product or service category terms to understand how market demand is shifting. If you are a traditional travel agency, comparing “travel agency” vs “online travel booking” in Australia tells you something honest about the structural direction of your market.
Google Trends beyond web search: YouTube, Shopping, and News
Switching the search type filter opens up analysis across different Google surfaces.
YouTube Search is valuable for businesses considering video content. A topic trending strongly on YouTube Search but not Web Search indicates an audience that prefers video content, which shapes your content format decision before you commit production resources.
Google Shopping trends show purchase intent signals. A rising Shopping search trend for a product category often precedes increased competition in Google Shopping Ads and rising CPCs. Spotting these trends early gives you a window to capture traffic before the cost of paid acquisition rises.
Google News trends show media attention cycles. Useful for PR and content marketing, useful for businesses that want to comment on or create content adjacent to news cycles relevant to their industry.
Google Images is often overlooked. Businesses in highly visual industries (interior design, food, fashion, landscaping) can use Image Search trends to understand which visual topics are gaining interest before web search volume catches up.
Exporting and combining data
Every Google Trends chart has a download icon in the top-right corner. Clicking it exports the underlying data as a CSV. This unlocks analysis that is not possible inside the Trends interface itself.
Once you have the CSV, you can:
- Build charts in Excel or Google Sheets with precise control over formatting
- Overlay Trends data against your own traffic data from Google Search Console or Google Analytics to correlate market demand with your own performance
- Track the same metrics over time by saving and comparing exports from different periods
- Share formatted charts in client reports or internal presentations without needing to screenshot the Trends interface
The export format uses weekly or daily data points depending on the time range selected. For time ranges shorter than 90 days, data is available daily. For longer ranges, it is weekly. The “2004 to present” view provides monthly data.
Limitations and what the data cannot tell you
Google Trends data is an honest signal if you understand what it is actually measuring. Most misuse comes from treating it as something it is not.
It shows relative interest, not absolute volume. You cannot use a score of 80 vs 60 to infer that one term gets more searches than another in absolute terms, especially when comparing different time periods or different terms with very different volume levels.
Low-volume keywords do not appear. If your keyword has less than a certain threshold of searches (Google does not publish the exact threshold), it will return no data or a flat line at zero. This makes it a poor tool for niche keyword research in specialist markets.
The data is sampled, not complete. Google Trends uses a sample of searches, not every search. This means there can be statistical noise in the data, especially at smaller geographic scales or shorter time windows.
Topics and search terms behave differently. Searching by Topic (Google’s structured knowledge graph entity) captures more related searches than searching by a specific string. “Apple” as a search term returns a mix of fruit and Apple Inc. results. “Apple Inc.” as a Topic specifically captures searches related to the company. For brand and entity research, use Topics where available.
Real-time data has a lag. The past hour view can be 24 to 48 hours behind actual searches. For truly breaking news, social listening tools respond faster than Google Trends.
It does not tell you why. A spike or drop in a trend line tells you that something changed. It does not tell you what caused it. Diagnosing the cause requires cross-referencing with other data sources: news archives, Google Search Console, your own analytics, and market knowledge.
An Australian-specific use case: financial year content
Australian businesses often miss the EOFY content opportunity. Searches for tax deductions, depreciation schedules, business expenses, and accounting services spike sharply in June and July every year without fail. If your business is adjacent to any of these topics (bookkeeping software, vehicle leasing, office equipment, professional services), an EOFY content piece published in April or May can generate recurring traffic every year.
FAQs
What is Google Trends and what does it show?
Google Trends is a free tool from Google that shows the relative popularity of search terms over time. It analyses a sample of Google searches and presents the data as a score from 0 to 100, where 100 represents the peak search interest for the term in the selected time period and region. It shows trends and seasonal patterns, not absolute search volume.
How accurate is Google Trends?
Google Trends is a useful directional tool but is not precise. The data is based on a sample of searches, not every search Google receives. It is accurate enough for understanding broad trends, seasonal patterns, and relative comparisons between terms. It is not reliable for estimating exact monthly search volumes or for researching low-volume niche keywords that fall below Google’s display threshold. Use it alongside SEMrush or keyword research tools for volume data.
How do I use Google Trends for Australia specifically?
Set the region filter to Australia (or to a specific Australian state) before analysing any data. Global data is dominated by the US and does not reflect Australian search behaviour. Within Australia, you can also use the subregion view to see interest broken down by state, which is useful for geo-targeted campaigns and local SEO strategy.
What is the difference between a Search Term and a Topic in Google Trends?
A Search Term searches for that exact string (and common misspellings). A Topic is one of Google’s structured knowledge graph entities, capturing searches about a concept regardless of the exact words used. Topics generally give broader and more reliable data for brands, companies, and named entities. When a Topic option appears as you type, it is usually the better choice for brand and entity research.
Does Google Trends show real-time data?
The past hour and past 4 hours views show near real-time data, but typically with a lag of 24 to 48 hours. Longer time ranges (days, months, years) are updated more periodically. For truly breaking news and real-time signals, social listening tools respond faster than Google Trends.
Can I use Google Trends to compare competitors?
Yes. Enter your brand name and competitor brand names as separate terms in the comparison view. The chart shows relative search interest for each brand over time, revealing which brands are growing in awareness, which are declining, and how your brand tracks against the market. For the most accurate results, use the Topic option if Google offers it for your brand, rather than the plain search string.
Why does my keyword show no data in Google Trends?
Google Trends only shows data for terms that exceed a minimum search volume threshold. If your keyword is very niche, highly specialised, or primarily searched in small volumes, it will return a flat line or a “not enough data” message. This does not mean people are not searching for it, it means the volume is too low for the tool’s sampling methodology to return reliable data.
How do I use Google Trends for SEO keyword research and content planning?
Google Trends complements keyword research by showing momentum and seasonality data that volume-based tools cannot provide. Use the 5-year view to check whether a keyword target is growing or declining in Australia. Use the Rising queries section to find emerging keyword opportunities before they peak. Use seasonal patterns to plan your content calendar so that articles are indexed and ranking before demand peaks. Then validate findings with absolute volume data from SEMrush or Google Keyword Planner.
Does Google Trends have an API?
Google does not offer an official public Google Trends API. However, there is a widely used unofficial Python library called pytrends that lets developers access Trends data programmatically. It replicates the functionality of the Trends website and is commonly used for automated monitoring and data export. Note that as it is unofficial, it can break when Google changes its interface.
How is Google Trends different from Google Keyword Planner?
Google Keyword Planner shows estimated monthly search volumes for keywords, primarily for Google Ads planning. Google Trends shows relative search interest over time and geographic distribution. Keyword Planner is better for understanding absolute volume and choosing keywords by search count. Google Trends is better for understanding momentum, seasonality, geographic variation, and emerging topics. The two tools are complementary and most effective when used together.
Want to put search data to work for your business?
Understanding what people are searching for is one thing. Building a strategy that captures that demand before your competitors do is another. Click Click Media (CCM) has been helping Australian businesses grow organic traffic since 2008. A free SEO audit covers your keyword opportunities, your current search visibility, and exactly where you are leaving traffic on the table.